

Method
From the first day of classes, I attempt to ground and unground my first year composition classroom in the rhetorics of space and place. On our first meeting, my students learn about the topoi and how we might explore or find our point of stasis within those places. We question cases of when it proves advantageous to hold ground or move off it. We discuss the polis and its intricate weaving of people and activity (McEwan 1993, p. 81), that center of our collective thinking, that most civil of places, where we might all come together, or move nearer if we wish to live in harmony with one another. We visualize the agora, that gently sloped Athenian space of commerce and public debate. How in our digital world, we are governed by algorithmic protocols designed to aid consumption by expanding the commercial power of the agora over its public function, how these algorithms and other technologies control or impede our coming together—and what might happen if we replaced algorithms with agorarithms—and what might this look like? We also discuss the power of the chora, that place outside of the walls of the topoi, where we become something different than what we are, that place that we wander into, wash out of. We learn that theory is a way of seeing, a way of thinking, a “way” we test, must test, through our critical practice.
We begin our GIS unit by conducting a group data collection. This task teaches students how to use the Esri Survey 1-2-3 data collection tool and it introduces them to the kinds of problems that might be interesting to research using this data collection tool. In my own research, I am interested in how the design of space and place influences behavior. On the campus where I teach, the design allows for dangerous automobile ingresses that allows cars to penetrate deep into the center of campus, thus allowing students to drop off and pick up their friends in heavy pedestrian areas. I present this design problem to my students using stasis theory. Stasis theory is the metacognitive thread that runs through this project as my students fix and unfix their thinking in relation to the problem and to one another. The following shows how this heuristic might be used by a sample group:
1. Conjecture: Did something happen? What are the facts?
Our campus has a dangerous mix of pedestrians and automobile traffic.
2. Definition: What is the issue of importance?
Cars are cutting through the center of campus to drop off students.
3. Why is this an important question?
This increases traffic and poses a safety risk to pedestrians.
4. What is the question you are proposing?
How can we track where these drop-off hot spots are located so as to draw
attention to the problem?
Working through stasis theory allows my students to explore the implications of this design problem on our campus. This heuristic proves especially powerful in groups in that each individual’s experiences adds to the wealth of knowledge that will serve as evidence for making claims. When I introduce the idea that we have many other design problems on our campus to which we might attend, I can see the skepticism on many of my students’ faces. Most of my students are really happy to be at Clemson University. Really excited that we have a good football team, and not quick to find fault. But once they engage in critical thinking and conversation, students tend to agree that we do have problems on our campus and that we need to consider their many implications. Most of my students have witnessed accidents or near-accidents on campus involving buses, cars, bikes, and pedestrians. I also hear groups taking parts in conversations about health concerns, aesthetics, as well as other matters concerning our general campus culture and well-being.
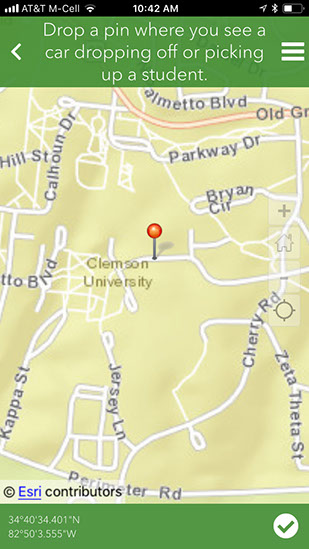
The next step in this practice is teaching my students to learn how to make, manage, and disseminate data collection tools. I begin by requiring my students to download the Esri Survey 1-2-3 app which turns their mobile phone into a data collection tool. To teach students to collect data, I create a sample data collection tool in class. The tool asks students to collect data whenever they see a car dropping off or picking up students. Students mark the location on a map, note how many passengers are dropped off, and take a photo of the automobile. This sample exercise gives my students a good idea of the potential for a data collection tool. Outside of my teaching, I participated in a similar data collection where a large group of students, each working in specific grids, mapped the various trees on our campus. We were then able to merge our data and in a short amount of time collect a considerable amount of data that we could not have managed individually. I build this data collection tool for our project in class so my students can be introduced to the different Survey 1-2-3 tool options that are available so as to prepare them for the time they will be designing their own data collection or survey tool. Once I finish my tool, I can easily share it with my students through email which allows us to collaborate in the data collection. One of the benefits of this data collection tool is that it can also be used as a survey tool that can easily be disseminated through email or via social media to students on our campus or even to individuals outside it .
I ask my students to start thinking about the kinds of problems and questions that they think they might like to study using this technology. How can we use the survey tool to ask questions about problems on our campus that speak to the spaces and places we inhabit and how might the data we collect help to complicate our thinking about these same spaces?
By the following class my students have collected some 40-50 data points that show where cars are dropping off and picking up students. I share the data we have collected with the class and together we look at how we might analyze the data using the Esri Survey 1-2-3 software. Then, I show the students how we might visualize that tabular data using ARC GIS by creating a data map, and how to import that data map into a web application that will eventually allow my students to communicate and disseminate their findings.
The homework assignment that night is to think about other questions we might pose that address problems on our campus. Using an online discussion thread, I ask that my students write their proposal following stasis theory. At the beginning of the next class, I let the students read through the proposals and comment on / add to the proposals they would like to study. By examining the reply thread, I am able to gage the popularity of various proposals and start moving students into groups that interest them. But before I do, I also want my students to think of state and nationally-based problems that emerge from examining data/map sets as a heuristic. Based on the available data/map sets in Esri Arc GIS, what new questions might we ask that will explore how we think about the spaces and places we inhabit? For example, one of data/map sets details polluted rivers and streams in South Carolina. Upon viewing the map, my class is generally disturbed to see that so many streams in our state are polluted. One student suggested that we might survey our local Clemson student population to see where each lives and whether or not they believe their local streams and rivers to be clean or polluted.
From the twenty-six data map sets that I gave to students, my classes decided to address the following questions:
1. If you live in South Carolina, do you think water pollution is a problem? (USA
Polluted Waters)
2. Do you think crime is a problem? (2016 USA PERSONAL CRIME)
3. Where have you seen the best night sky? (EARTH AT NIGHT)
At this point each group is asked to build a survey using Esri SURVEY 1-2-3. To gather our data about space and place, emotion and affect, each group is asked to build a survey using Esri SURVEY 1-2-3. I require my students to ask an array of questions, qualitative and quantitative, multiple choice and short answer, as well as one question that requires the respondent to drop a pin giving a geographical location. The final step in the process is for each group to distribute the survey. Each group needs a sample size of at least 40 respondents, the minimum needed to activate software that generates graphs and word clouds for analysis. In a subsequent class, I hold an Esri ARC GIS training session where students individually build map applications (story maps). For this part of the assignment, each group member needs to access the group survey data and generate an individual map application. While I encourage my students to continue working in groups, each student has to develop an individual project for an individual grade (Johnson et al., 1998).
In ARC GIS mapping, each student learns to:
1. manage data and assets
2. import and manipulate survey layer data
3. manipulate map appearance and symbology (color, value, size, class)
4. define and design legends using first, second, and third degree labeling
5. add and manipulate various base maps
Once students build a smart map that best represents their data set, they export their maps to Esri Story Maps. Esri Story Maps offers a variety of turnkey formats that allow the user to customize a story map from a stock template. One advantage to this communication system is that all aspects of the application may be manipulated to best visualize the data. It also allows embedding so that videos and images can be easily incorporated, even allowing Story Maps to be embedded within story maps. I should say that Esri Story Maps are not great tools for oral presentations; rather, they are tools that afford usability in our communications, which has a great benefit from a teaching design standpoint. Rather than creating a presentation, I ask my students to think about usability and how their user might come to experience their Story Map in both a meaningful and functional way. Students are given an additional two days to finalize their individual designs, then given a few minute in their respective groups at the beginning of the next class to problem solve any issues. During this revision period, I stress the concept of affinity spaces (Gee, 2013): the idea that students might find peers in class and outside it with whom they might collaborate, each helping the other wrestle through the trials of learning new technologies.
To present their work, the class forms new groups containing one member from each survey question group. In this setting, students use stasis theory to explain their work to their classmates and then show off the features of their communication design. After this shift to another group, many of my students express a desire to further revise their work based on the work that they see emerging out of other groups, so I allow additional revisions. In that I want to see my students do their best work, I see this agreement as a win-win.