Full size versions of all images and charts included in the website are provided below.[1] I have also broken this section up into subsections and organized the included graphics according to where they are included in the web-text. The numbers listed below represent each sections location in the main navigation bar above.
Graphics: 1 Background Section
Figure 1.1 – When uploading videos to YouTube, students have some control over who can watch the video by adjusting the privacy settings. However, if the student selects “Private” and forgets to add the instructor to the list of people who can access the video this image will be displayed when the instructor tries to watch or grade the student’s work.
Graphics: 2 Participants
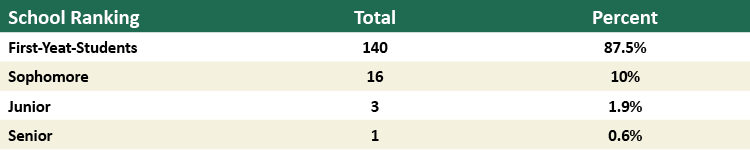
Table 2.1 – Pilot Study Participant Class Standing.
Table 2.2 – Pilot Study Participant Gender.
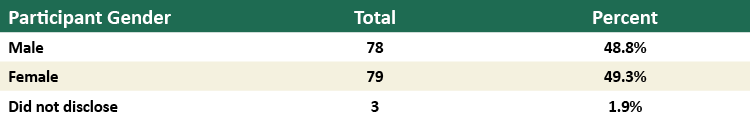
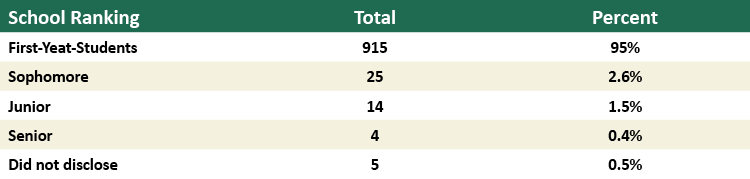
Table 2.3 – Main Study Participant Standing.
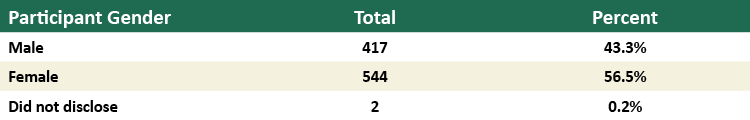
Table 2.4 – Main Study Participant Gender.
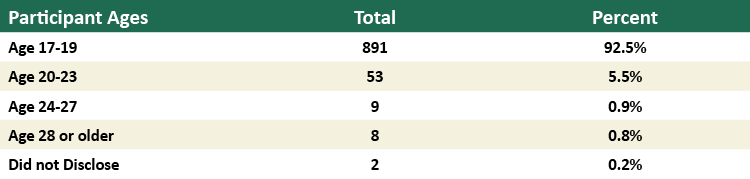
Table 2.5 – Main Study Participant Ages.
Graphics: 3 Methodology Section
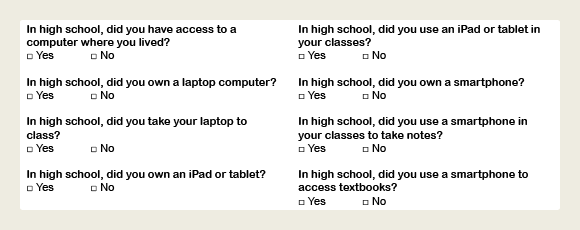
Figure 3.1 – Survey questions related to access.
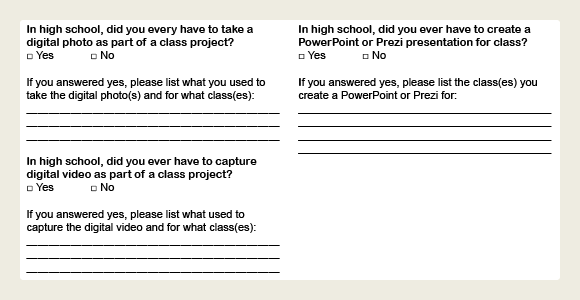
Figure 3.2 – Survey questions related to multimodal tasks completed as part of an assignment in high school
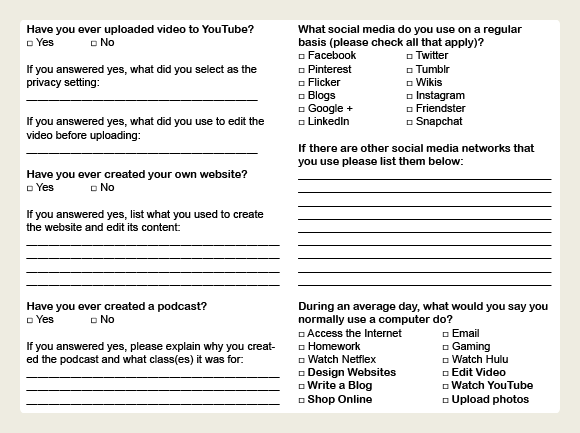
Figure 3.3 – Survey questions related to online content production.
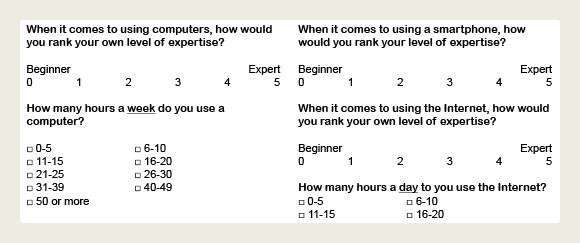
Figure 3.4 –Survey questions related to level of expertise and usage.
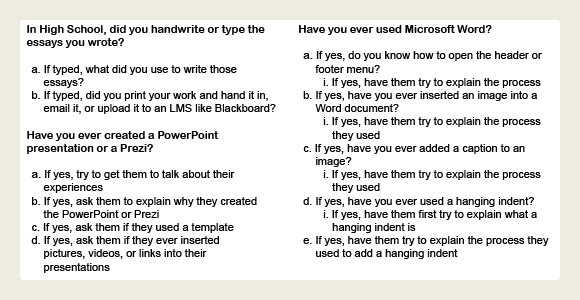
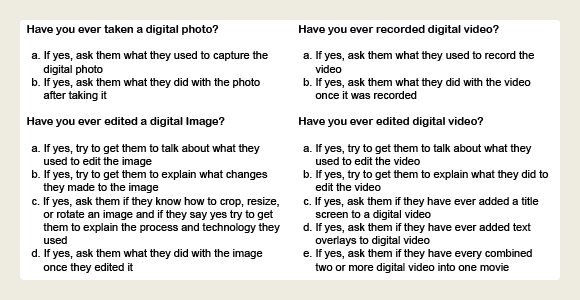
Figure 3.5 –Questions asked during focus group sessions.
Figure 3.6 –Questions asked during focus group sessions.
Graphics: 4 Results Section
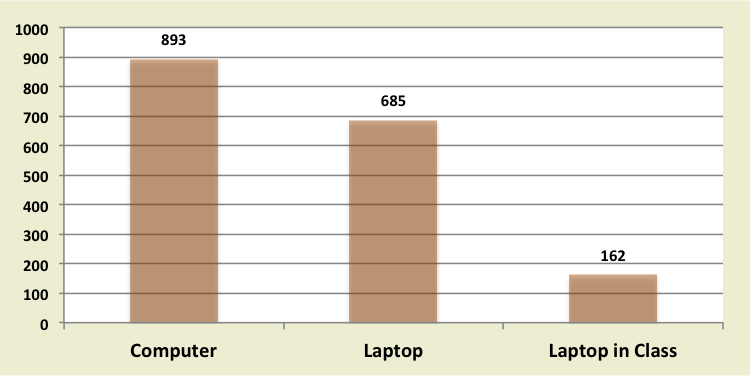
Figure 4.1 – Number of participants who claimed they owned and took the listed technology to class while in high school. (Note: Four left the computer question blank and three left the laptop to class question blank.)
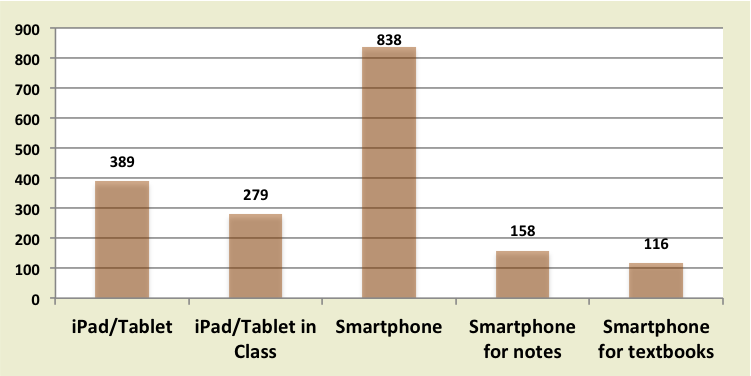
Figure 4.2 – Number of participants who claimed they owned and took the listed mobile technologies to class while in high school. (Note: One left the iPad or tablet questions blank and two left the smartphone questions blank.)
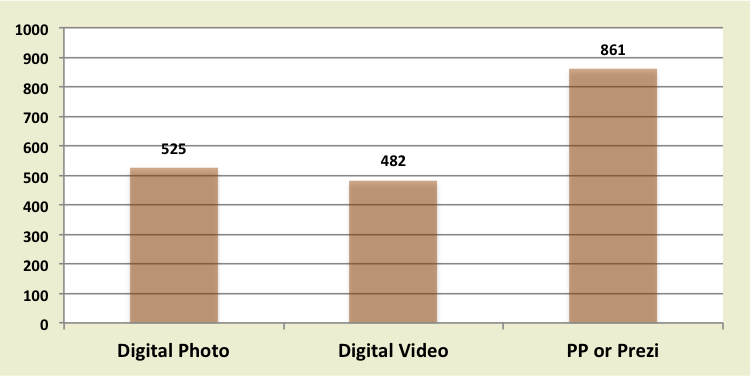
Figure 4.3 – Multimodal tasks completed in high school. (Note: Three left the digital photo and digital video questions blank and one left the PowerPoint or Prezi question blank.)
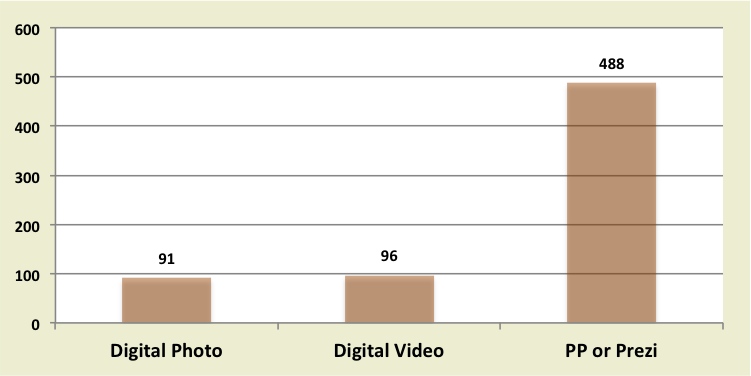
Figure 4.4 – Multimodal tasks completed for an English class. (Note: The totals only include English, Literature, or Creative Writing courses.)
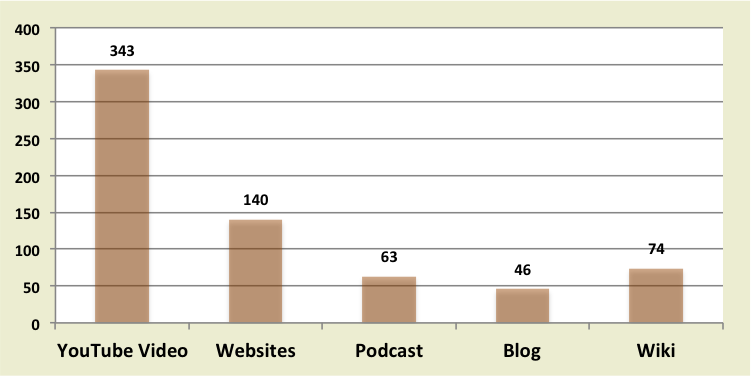
Figure 4.5 – Number of participants with prior experience creating the content listed. (Note: Two left the website question blank and three left the podcast question blank.)
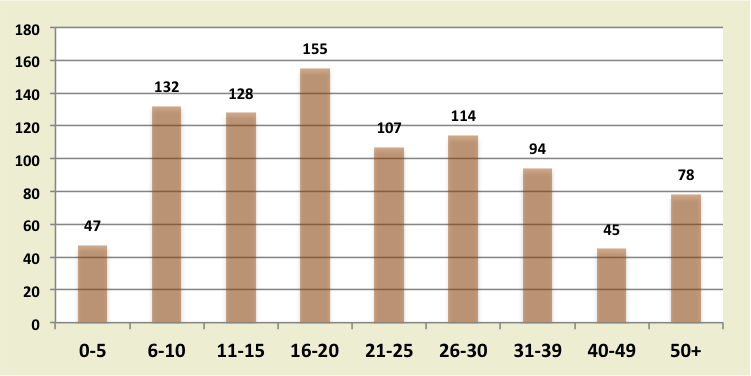
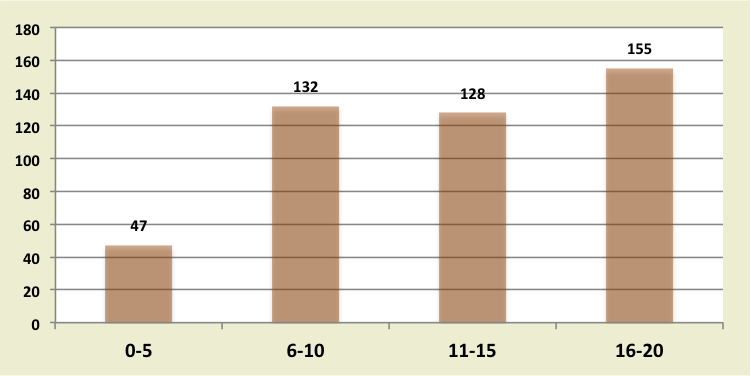
Figure 4.6 – Number of hours per week participants claimed they used a computer.
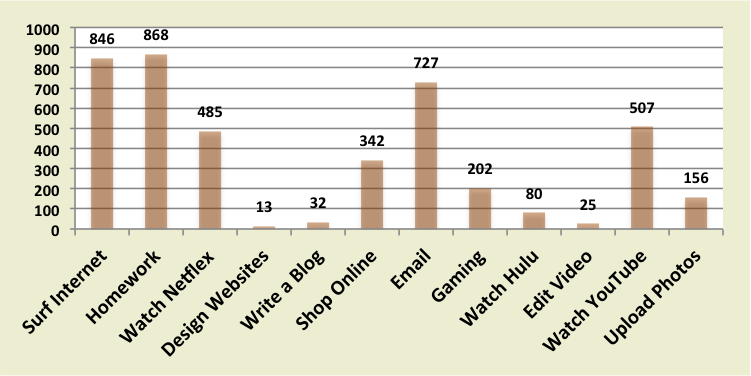
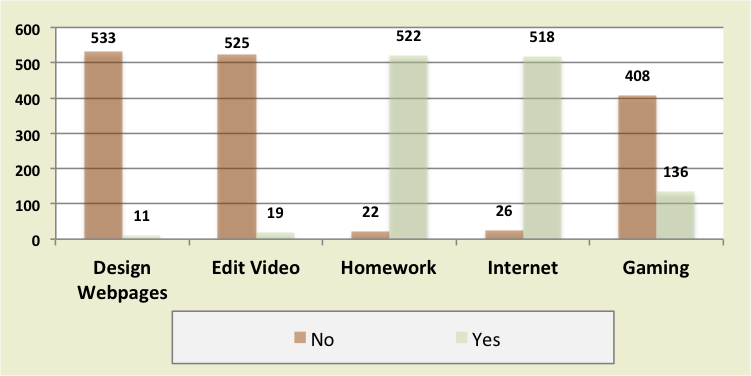
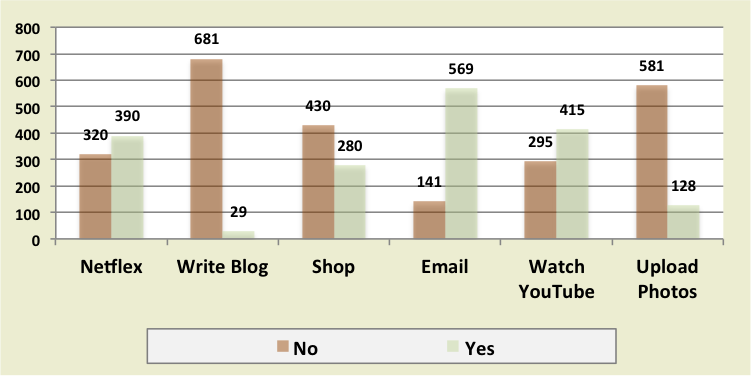
Figure 4.7 – Number of participants who claimed they used a computer to complete the listed activities during their average day.
Figure 4.8 – Number of hours per day the participants claimed they used the Internet.
Graphics: 5 Discussion Section
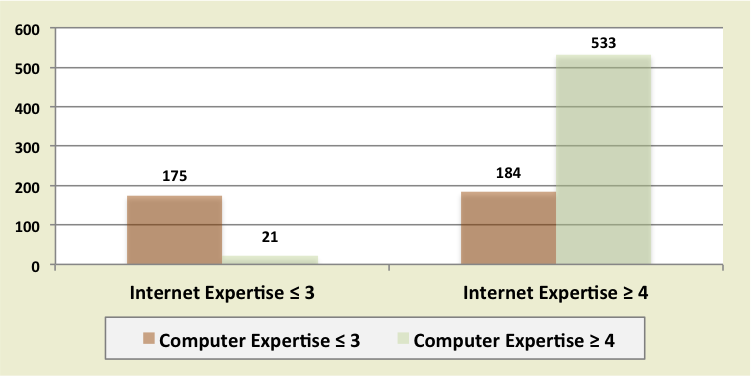
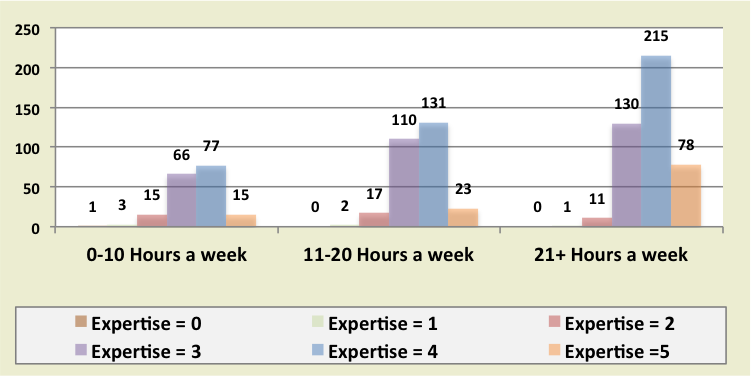
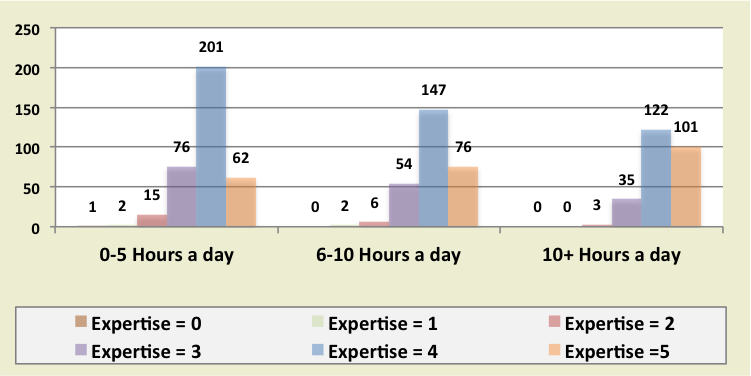
Figure 5.1 – A comparison between the participants’ self-ranked levels of expertise (359 self-ranked their computer expertise at 3 or less and 544 self-ranked their computer expertise at 4 or more).Figure 5.2 – A comparison between the participants’ self-ranked level of expertise using computers and how many hours they claimed to use a computer every week. (Note: One participant selected 0, 6 selected 1, 44 selected 2, 308 selected 3, 427 selected 4, and 117 selected 5. Two claimed to be more than experts, 3 left the expertise and 8 left the usage questions blank.)Figure 5.3 – A comparison between the participants’ self-ranked level of expertise using the Internet and how many hours each day they claimed to use the Internet. (Note: One participant selected 0, 4 selected 1, 24 selected 2, 165 selected 3, 470 selected 4, and 239 selected 5. Two left the expertise and 3 left the usage questions blank.)Figure 5.4 – Activities participants who claimed to be almost expert or expert computer users claimed they completed during their average day.Figure 5.5 – Activities participants who claimed to be almost expert or expert Internet users claimed they completed during their average day.
Graphics: 6 Conclusion section
Figure 6.1 – When uploading videos to YouTube, students have some control over who can watch the video by adjusting the privacy settings. However, if the student selects “Private” and forgets to add the instructor to the list of people who can access the video this image will be displayed when the instructor tries to watch or grade the student’s work.
Notes
To see a larger version of the images on a mobile device, shift the orientation of the device to landscape.