Footnote
X
Participants: Section Overview
Below is a rationale for decisions made when determining who should be included or excluded from the study. A description of how participants were recruited is provided. Also included are specific characteristics of the participants and some general enrollment information for the academic year data was collected for the main phase of the study. See the Methodology Section for information on how data was collected and analyzed.
Participants: Selection, Recruitment, and demographics
As I stated in the Background Section, one purpose for conducting the study was to see what skills associated with building a digitally mediated multimodal composition students might have learned before enrolling at UAB. To gather that information, I wanted to make sure I recruited participants during their first year. I did not want to go into local high schools to recruit participants because that activity would have eventually skewed the data I collected. There would have been no guarantee the students would end up going to UAB and the growing amount of out-of-state and international students attending UAB would not have been represented in my eventual data.
To account for my concerns regarding participants, at least as many as I could control, I decided to gather data from students enrolled in first-year, first-semester composition courses (EH 101). By doing so, I could insure participant responses would be from actual UAB students and that their high school experiences would still be somewhat fresh in their minds. Plus, their answers would not be as influenced by their experiences at UAB and what skills they might learn in their other college-level classes. I also excluded my own students to protect anonymity and make sure participation remained voluntary.
Below is a breakdown of some demographic information from the 1,123 students who chose to participate in the pilot phase or main phase of the study. In what follows I use the term “first year” to identify students who were in their first year at UAB. Even though UAB still uses the term “Freshmen” on all official documents, I have used the term “First-Year-Students” when identifying students who have not yet progressed into the university’s ranking of Sophomore.
Participants: Pilot Study Demographics
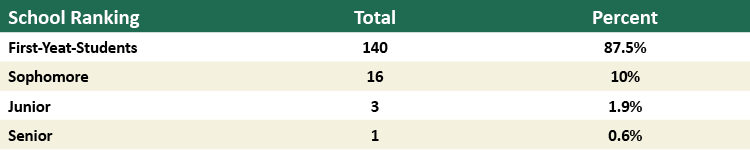
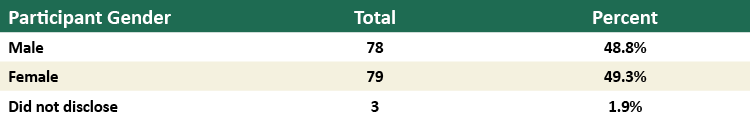
The pilot phase of the study took place during the Spring 2014 semester on UAB’s campus. During the pilot phase of the study, I visited nine out of the twelve EH 101 courses offered that semester. In total, I gathered surveys from 160 students out of a possible 240 enrolled in the classes I visited, which equals a 66% response rate. Figure 2.1 and 2.2 provides a demographic breakdown of the participants. In addition, 14 pilot study participants claimed English was not their native language and the participants were from 108 different high schools.[1]
Although I was only able to visit each classroom once and could only collect data from the students who were present when I visited the classroom, the demographic data indicated I would be able to include responses from the types of students I wanted to recruit for the study. However, based on the collected data I also realized I had overlooked transfer students. Transfer students do make up a large percentage of UAB’s student population and I wanted to make sure they were included and identified. I added a transfer student question to the survey and began the main data collection phase as outlined below.
Participants: Main Study Demographics
The main data collection phase of the study took place during the Fall 2014 and Spring 2015 semesters on the campus of UAB. During this phase of the study I visited 50 out of a possible 63 EH 101 courses held on UAB’s campus (41/50 during the Fall and 9/13 during the Spring). From those classroom visits I collected surveys from 963 students out of a possible 1,426 students who had enrolled in those courses at the beginning of each semester (844/1,153 in the Fall and 118/273 in the Spring), which equals a 68% response rate.[2] Like the pilot phase of the study, I was only able to visit each classroom once and could only collect data from the students who were present when I visited the classroom.[3]
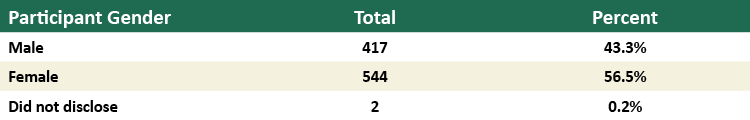
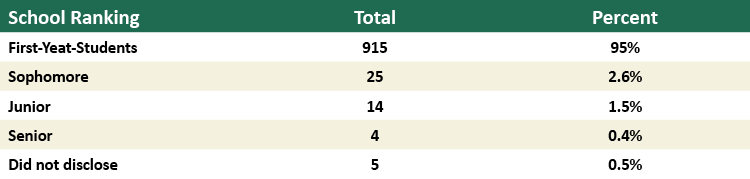
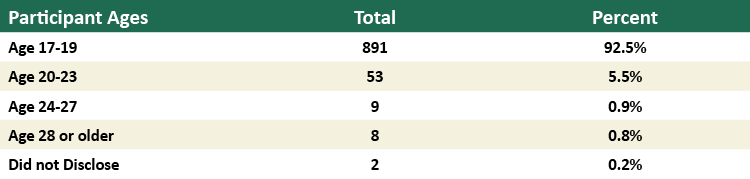
In total, 928 students who participated in the study claimed they were in their first year at UAB and as Figure 2.3 illustrates, 915 students indicated they were First-Year-Students (908 participants identified as First-Year-Students in their first year at UAB, 804 in the Fall and 104 in the Spring). Unlike the pilot study, I was able to attribute part of that discrepancy to transfer students because 31 participants claimed they were transfer students and five participants chose not to share their class ranking. The gender of the participants is illustrated in Figure 2.4, and Figure 2.5 provides an age breakdown of the participants.
The study also included participants from 327 different high schools; students who attended public high schools, private high schools, students who were homeschooled, and students who attended both in-state and out-of-state high schools were all included. Seven countries outside of the United States were represented and 76 participants claimed that English was not their native language. Further, students from most of the local high schools were represented in the study, including students from five out of the seven Birmingham City School System high schools.[4] In addition, the survey data represented participants from 111 different majors out of 120 possible areas of study offered at UAB.
Participants: UAB Demographics
To justify my sample size, what follows is a brief comparison between the study participants and UAB’s official enrollment figures. According to UAB’s Office of Institutional Effectiveness and Analysis, the total number of First-Year-Students enrolled during the Fall 2014 semester was 2,469: 2,328 full time students and 141 part-time students (Facts & Figures 2014-2015, 2015, p. 37). The Office of Institutional Effectiveness and Analysis also reported that 1,748 of those students were in their first year at UAB (UAB Entering Freshman Demographics, 2014). Meaning, the 804 First-Year-Students in their first year at UAB who participated in the study during the Fall 2014 semester represented 46% of the First-Year-Students who entered during that semester.
However, during the Fall 2014 semester, 202 students were also registered in one of the university’s EH 091 courses (a course usually reserved for First-Year-Students who did not score high enough on the ACT to enroll in EH 101). Plus, with only 1,250 total EH 101 spaces available, around 296 incoming First-Year-Students either did not enroll in a first-year composition course or tested into the university’s second-semester composition course EH 102. The enrollment situation was why I decided to run the study during both the Fall 2014 and Spring 2015 semesters. My hope was to include the students enrolled in one of the EH 091 courses or who had not registered for a first-year composition course.[5] Collectively, then, the amount of participants I was able to include in the study does represent 52% of the entering First-Year-Students as reported by UAB. In addition, the total number of entering First-Year-Students for the two years prior to the study and the year following the study was relatively consistent: 1,676 in the Fall of 2012; 1,773 in the Fall of 2013; and 1,621 in the Fall of 2015 (Facts & Figures 2015-2016, 2016, p. 50).
See the Methodology Section for information pertaining to how data was collected and analyzed.
Notes
- Data from the pilot study included response from participants who attended high school in Alabama, attended out-of-state high schools, and eight students attended high school outside out of the United States.
- To eliminate repeats, students enrolled in the classes I visited during the Spring 2015 semester were instructed not to participate if they had filled out a survey during the Fall 2014 semester.
- Because I was the only person who distributed and collected surveys, data collection for the main phase of the study was spread out over the first three months of each semester.
- Demographic information for those schools can be found on the Birmingham City School System website.
- One factor I could not control, and something not included in the university’s enrollment figures, was how many students stopped attending after the Fall 2014 semester and how many students enrolled for the first time during the Spring 2015 semester.