Footnote
X
Methodology: Section Overview
A detailed description of the methods used to gather and analyze the study data is included below. I have made sure to differentiate between information gathered during the pilot phase and the main phase of the study. During both the pilot phase and the main phase of the study, I used two different methods to gather both quantitative and qualitative data.
Methodology: Quantitative Data Collection and Analysis
As in the studies conducted by Paul Baepler and Thomas Reynolds (2014), Susanne Nobles and Laura Paganucci (2015), and Jessie Moore et al. (2015), the first instrument used to collect data was a paper-based survey. I used paper-based surveys for this project to ensure that participation remained voluntary, to ensure that participant responses remained anonymous, and so I could collect data from as many students as I could. No direct identification information was included on the surveys. In addition, outside of the changes I identified in the Participant Section, the same survey was used each semester I collected data.
In addition to the background questions, the survey included 28 questions: four multiple-choice questions; 21 yes or no task-based questions; and three Likert Scale style rating questions. Survey participants were provided the opportunity to explain their responses to 16 questions, most of which asked the participants to explain why they had selected “yes” on the yes/no task-based questions or if they completed a particular assignment for an English course. Due to the amount of data collected, I have not included every survey question in this web-text. Instead, the questions I address in this web-text can be found in Figures 3.1, 3.2, 3.3, and 3.4.
Beyond the demographic information already discussed in the Participant Section, the survey questions can be grouped into the following four categories:
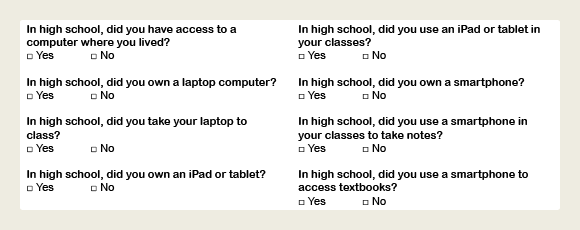
- General questions regarding access to technology during high school (See Figure 3.1)
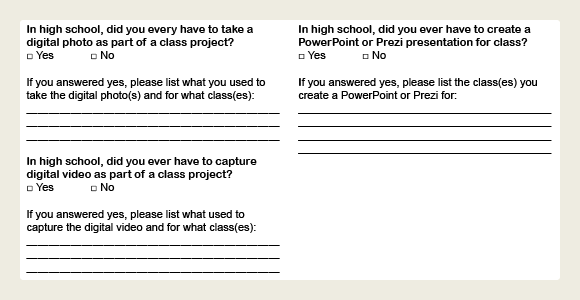
- General questions regarding if any required multimodal assignments were completed while in high school (See Figure 3.2)
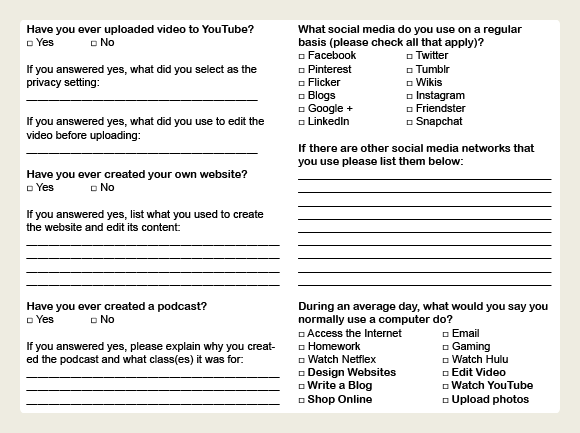
- General questions to see if the students were contributing online content (See Figure 3.3)
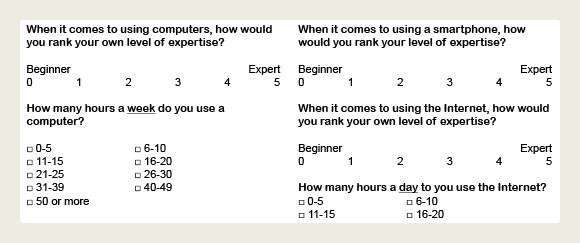
- General questions regarding technological expertise and how the participants used technology during their average day or average week (See Figure 3.4)
While collecting data for the study, I added all of the survey questions to an IBM SPSS® database and coded all of the quantitative variables.[1] Once all of the data was collected, the answers I received from the participants were then manually entered into the database for analysis.[2] Once the data was entered into the database it was checked for accuracy. The same software was used to analyze the data and generate totals for all of the questions. Any questions left blank by the participants have been identified. The Results Section and Discussion Section also only include responses from the study participants who self-identified as First-Year-Students who were in their first year at UAB, which reduced the number of participants included in my sample to 908 (804 during the Fall and 104 during the Spring).
Methodology: Qualitative Data Collection and Analysis
The second data collection method used during both the pilot and main data collection phases of the study was gathered during voice recorded, one-on-one interviews and focus groups. Participants for this part of the study were recruited when I visited the EH 101 courses and distributed surveys. Meaning, all of the interview and focus group participants had previously filled out a survey and were already familiar with the study. My purpose for conducting the interviews and focus groups was to gather some additional information and some generalizable data to help contextualize and explain the quantitative data I gathered with the survey. In total, I interviewed three students during the pilot phase of the study and talked to 23 students in seven small focus groups during the main phase of the study.
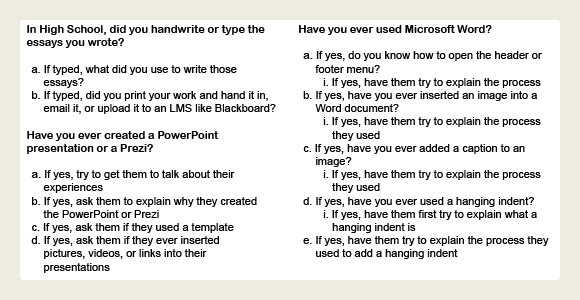
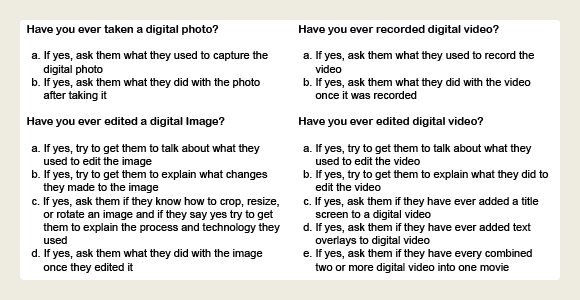
Although the conversations I had with the focus group participants often drifted into interesting and unexpected directions, to maintain consistency I asked the same questions during each interview or focus group. To make coding the data collected during the focus group sessions easier, participants were initially asked to respond to my questions with simple yes or no answers. Based on how the participants responded, the participants were then asked to expand on their answers as outlined in Figure 3.5 and Figure 3.6. Following each focus group session, the recordings were then reviewed and the answers to the yes or no questions were tabulated. Additionally, answers to the follow up questions were transcribed and analyzed for patterns as discussed in the Results Section and Discussion section. Like the quantitative data collected, not all of the qualitative data has been included and only those questions discussed in this web-text are included in Figure 3.5 and Figure 3.6.
Methodology: Localized and Contextualized Data
As I explained in the Background Section, the study was designed to gather localized and contextualized data from First-Year-Students at UAB. The main reason I choose to run a mixed-method study and collect both qualitative and quantitative data is because the qualitative data can help explain the quantitative data in the words of the participants themselves. For example, during the pilot study I asked the question: Did you handwrite or type the essays you wrote in high school?
One participant claimed: In ninth grade we mostly typed them, and then like tenth, eleventh, and twelfth we […] wrote them all.
Although the preceding quote does not fully explain why the participant did not complete any multimodal assignments in high school, it does provide a starting point. If some of the participants mostly completed handwritten, timed responses in their high school English classes, it would make sense that they did not create digitally mediated multimodal projects for those courses.
My last point above also illustrates why a localized and contextualized study of familiarity with digital technologies is such an important aspect of assessment. Regardless of where the inexperience originates from—access, financial, or a parent’s decision not to allow their children to use technology—any gap in familiarity needs to be addressed and represented in successful and non-exclusionary first-year composition pedagogy. If not, a large number of the students who enroll in those classes may not successfully complete the course regardless of their ability to write a sophisticated and well-informed argument. Plus, as the Results Section and Discussion Section both indicate, the participants included in my study had a variety of experiences composing multimodal texts before attending UAB.
Notes
- IBM SPSS® is a data entry program providing some statistical analysis features. This software was selected to speed up the process of tabulating quantitative data collected from the distributed surveys.
- I am indebted to my research assistant Paul Andrew Atchison for his work entering the study data into the database.