Included below are results from my IRB-approved study [IRB-300001030] pertaining to the participants’ previous levels of access and familiarity with some common digital composition and research technologies. Visit the Introduction for some background information about the study’s rationale. Visit the Methodology Section for information about the study’s design and participant recruitment. To see a detailed summary of how the study helped shape how I teach multimodal composition in a second-semester first-year composition course, see the Pedagogy Section.
3.1 Access and Familiarity
Previous works by Banks (2006)1, Rumsey (2009)2, Palmeri (2012)3, and Smith (2015)4 all highlight the fact that when discussing multimodal literacies, or pedagogical approaches to multimodal composition, both personal and institutional issues of access and familiarity are important. In fact, Lutkewitte’s (2014)5 edited collection Multimodal Composition: A Critical Sourcebook contains a whole section dedicated to access at the institutional level. As such, and as I stated in the Methodology Section, access and familiarity are important components to my study.
Part of the reason issues of access and familiarity are important to my study is directly connected to Selber’s (2004)6 claim that students will require direct, repeated, and integrated contact […] in order to become well-rounded individuals equipped with a keen and judicious sense of the technological work around them
(p. 235). The only way I could attempt to understand if my study participants had any direct, repeated, and integrated contact
with some of the technology they might use to complete a multimodal composition was to ask them questions related to their levels of access and familiarity with those types of technologies.
When planning the study, I also had to take into account that many of the participants I wanted to collect data from had only completed one semester of college. To address that issue, I decided to base many of my personal access and familiarity related questions around the participants’ experiences in high school.
In addition, although the number of instructors at the University of Alabama at Birmingham (UAB) that do include the production of multimodal texts grows every year, having students produce a multimodal project was not part of our shared syllabus when I designed the study. Meaning, if I had narrowed the participants' experiences down to a first-semester composition course at UAB the results, in many cases, would not be a true reflection of my participant’s previous digital composing experiences. See Figures 3.1 through 3.4 for a complete list of the questions I cover below.
3.2 Access to Common Multimodal Technologies
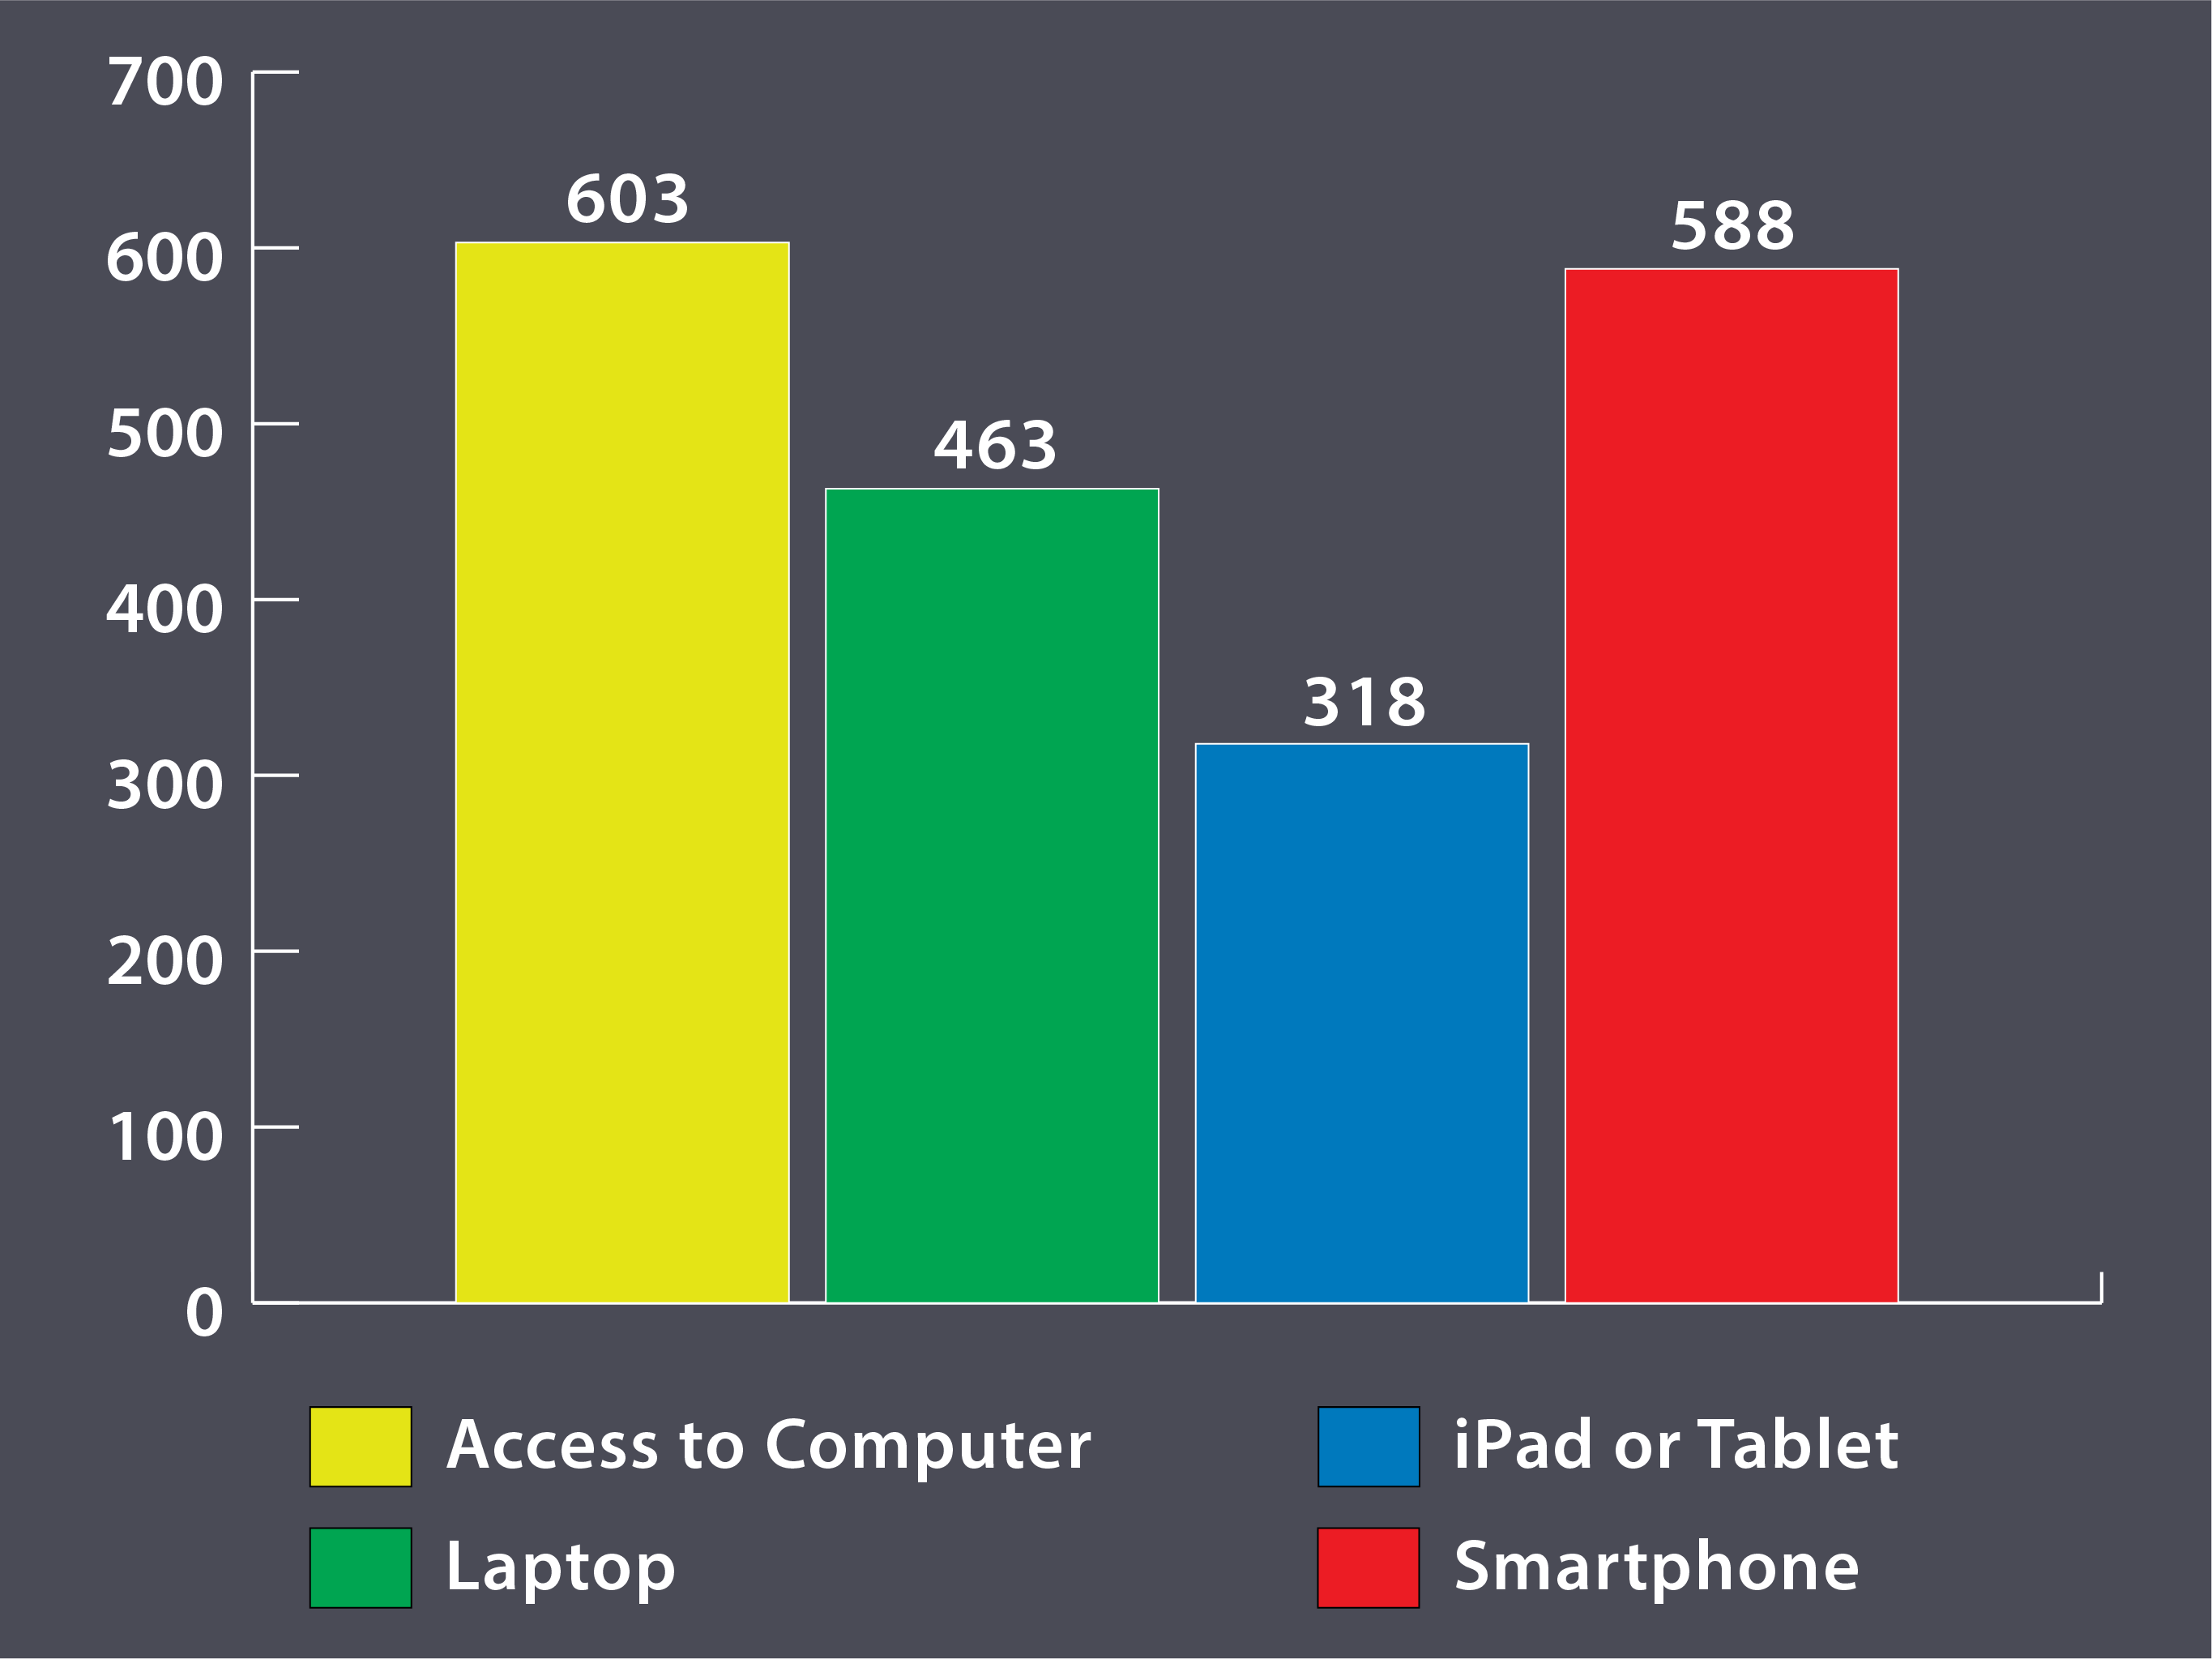
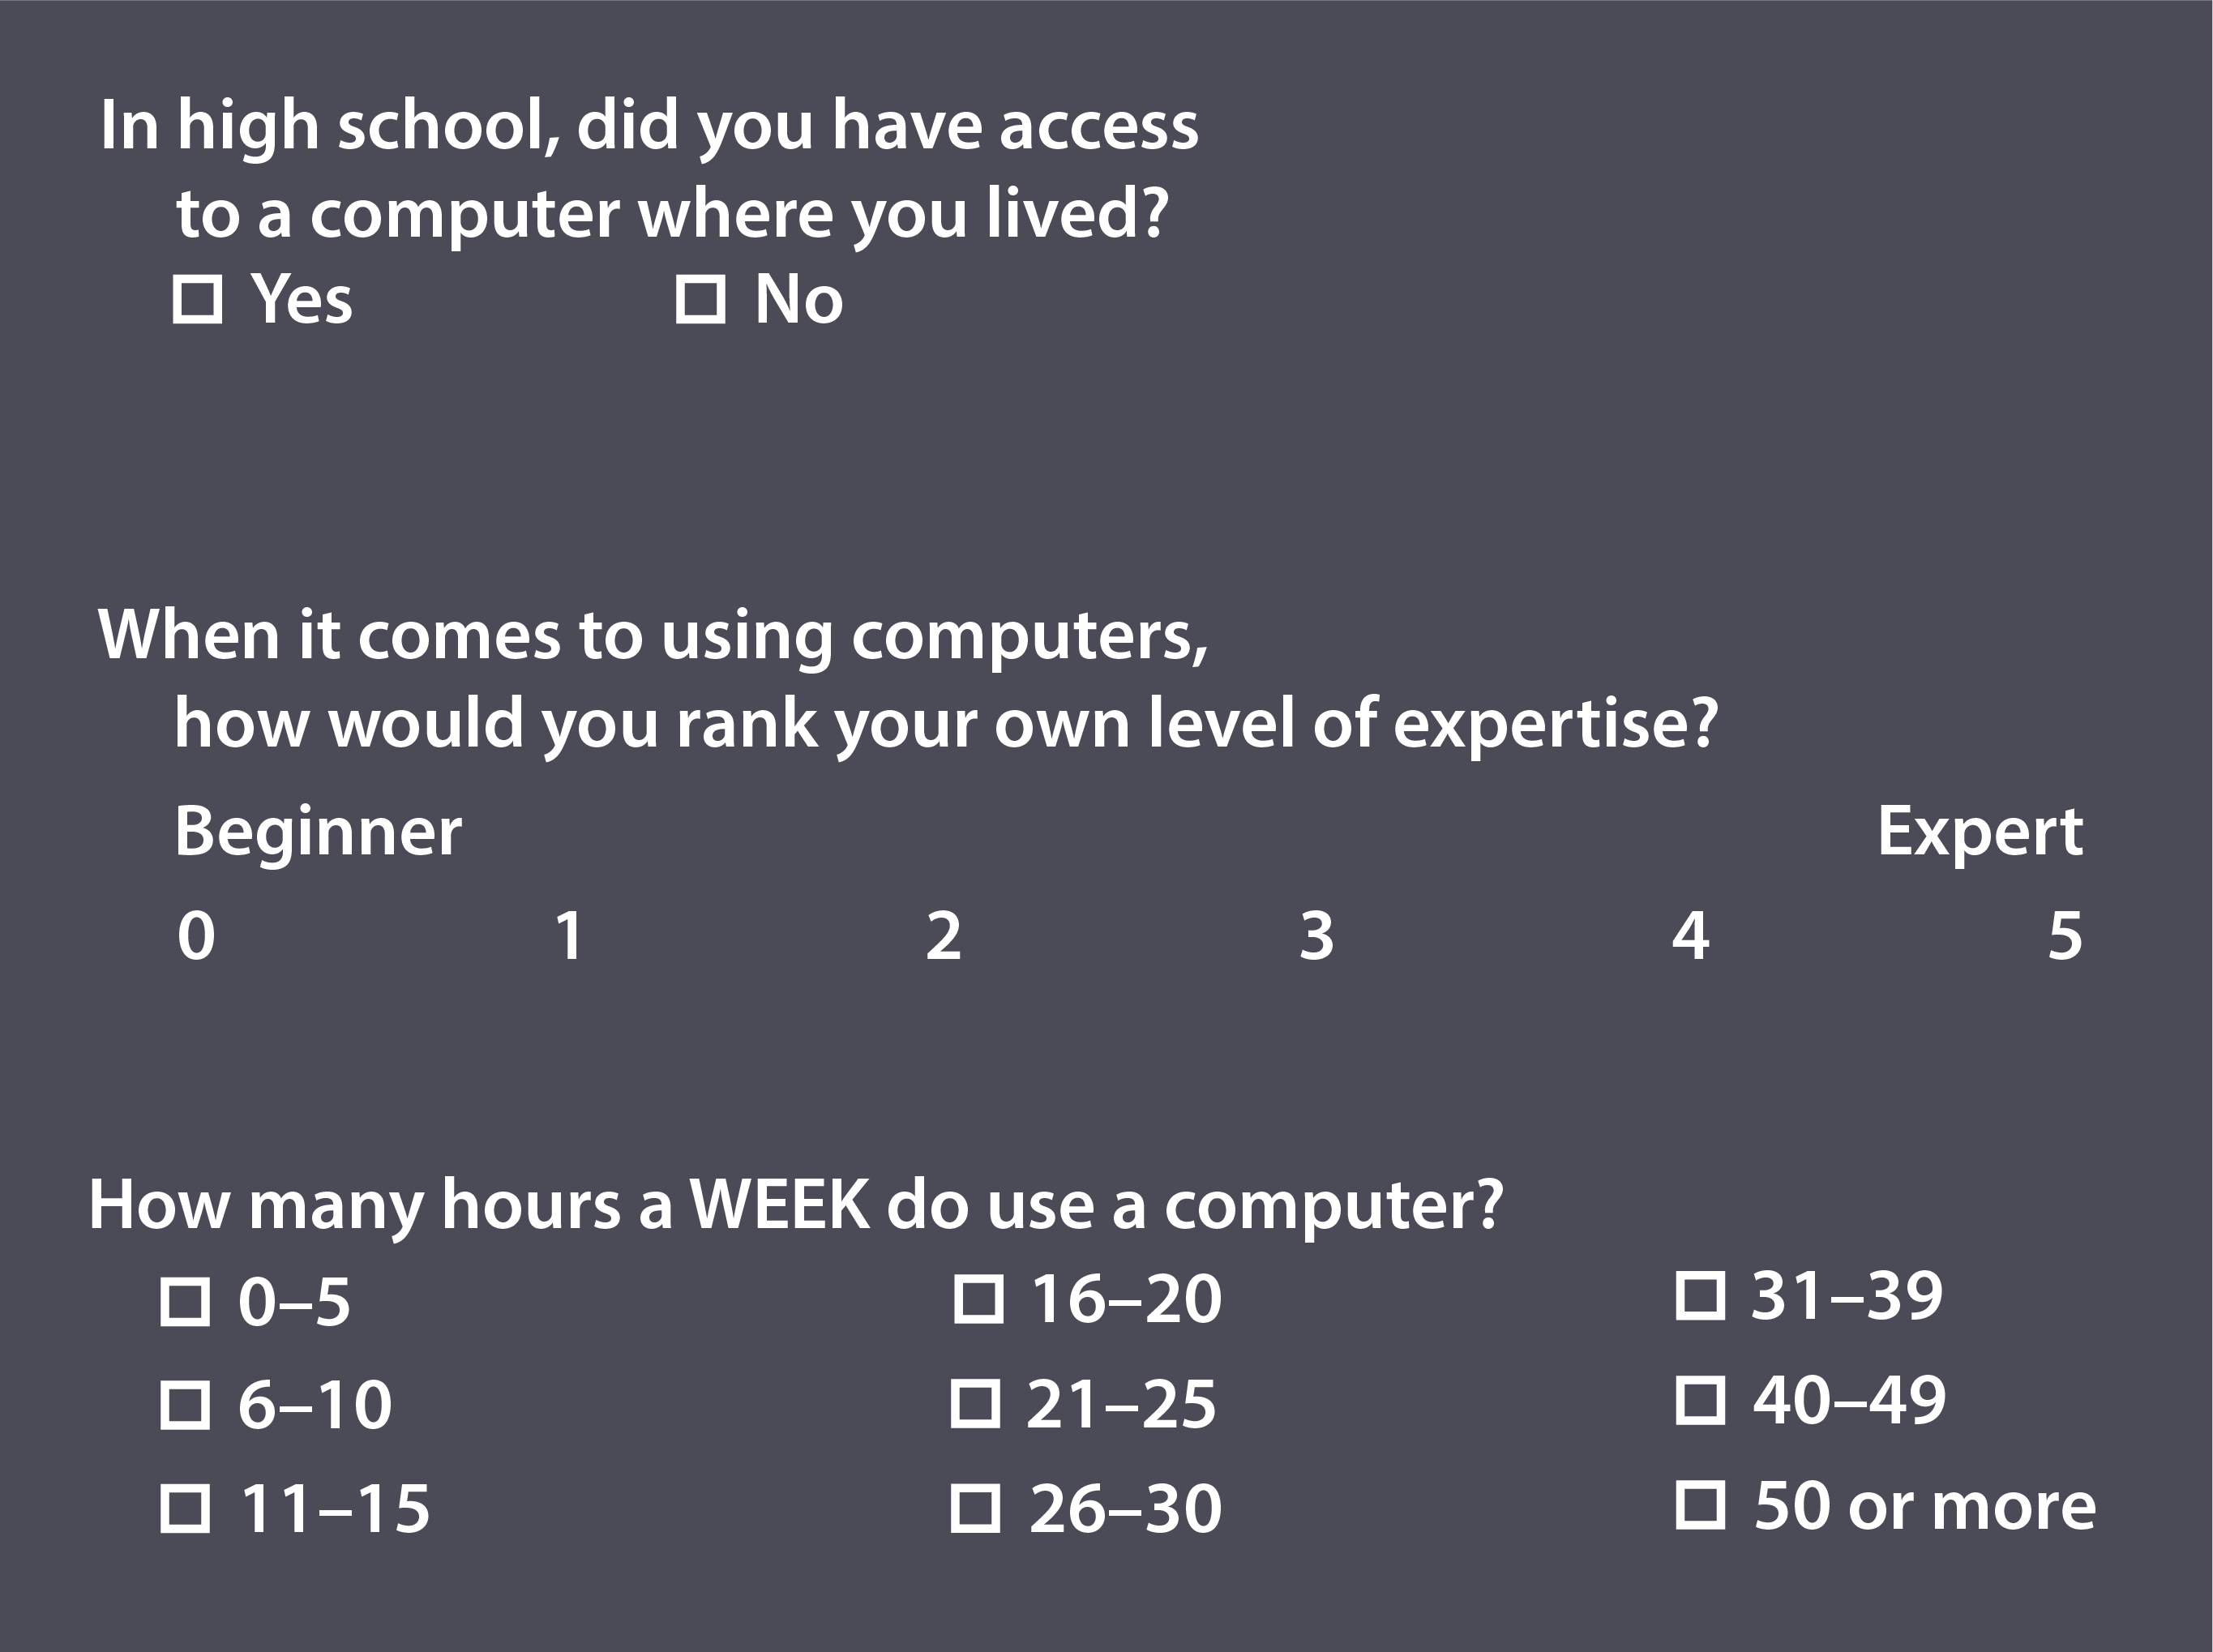
To begin the process of determining the study participants' level of experience using a few common digital technologies, I asked them four access–related questions (see Figure 3.5). When asked about access to a computer, 602 participants out of the 611 that answered the question indicated they did have access to a computer where they lived during high school. Eight participants said they did not have access to a computer where they lived in high school.
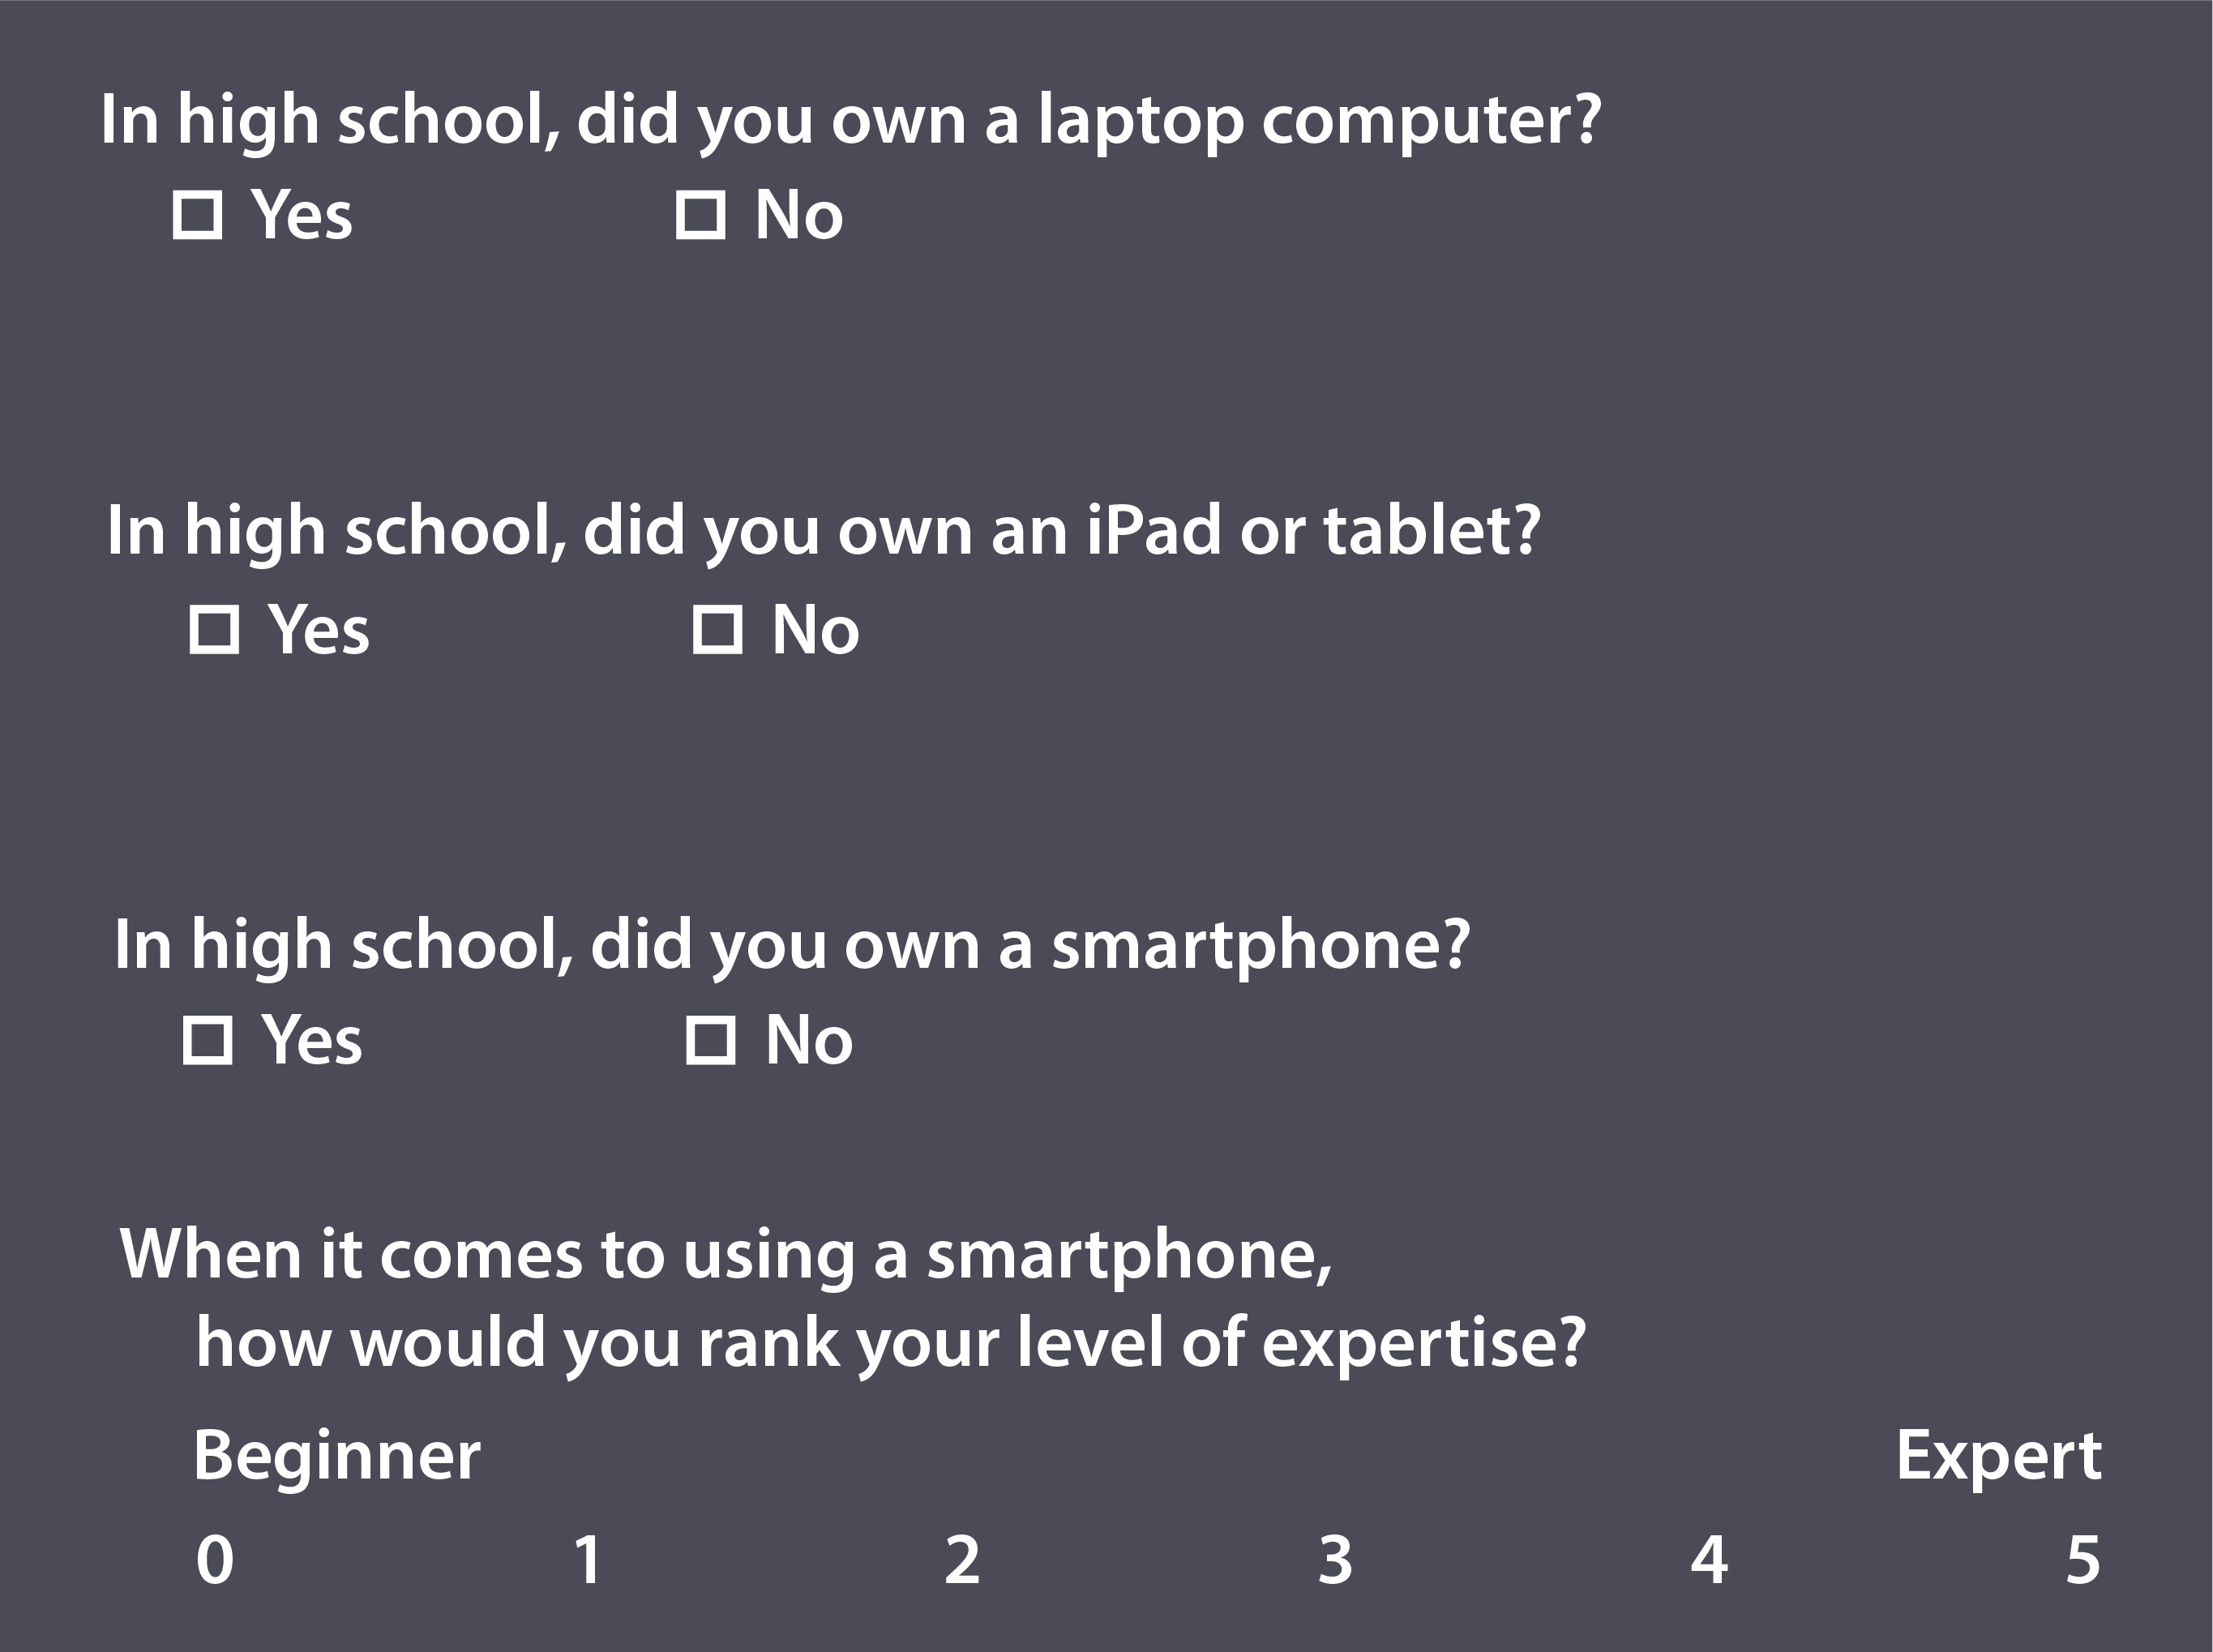
When asked about laptop computers, 453 participants said they owned a laptop computer and 151 said they did not own a laptop while in high school. When asked if they owned an iPad or tablet in high school, 318 indicated yes and 295 indicated no (one person left that question blank). Out of the 612 participants who answered the question, 588 participants claimed they owned a smartphone while in high school and 24 said they did not.
3.3 Expertise and Use
Having direct access was not the only metric I used in an attempt to understand the study participants’ level of familiarity with common digital composition technologies. I also wanted to know how often they used those technologies and to what degree they felt comfortable using them. My reasoning here was simple: Just because someone has access to something, does not mean they use it or understand how to use it.
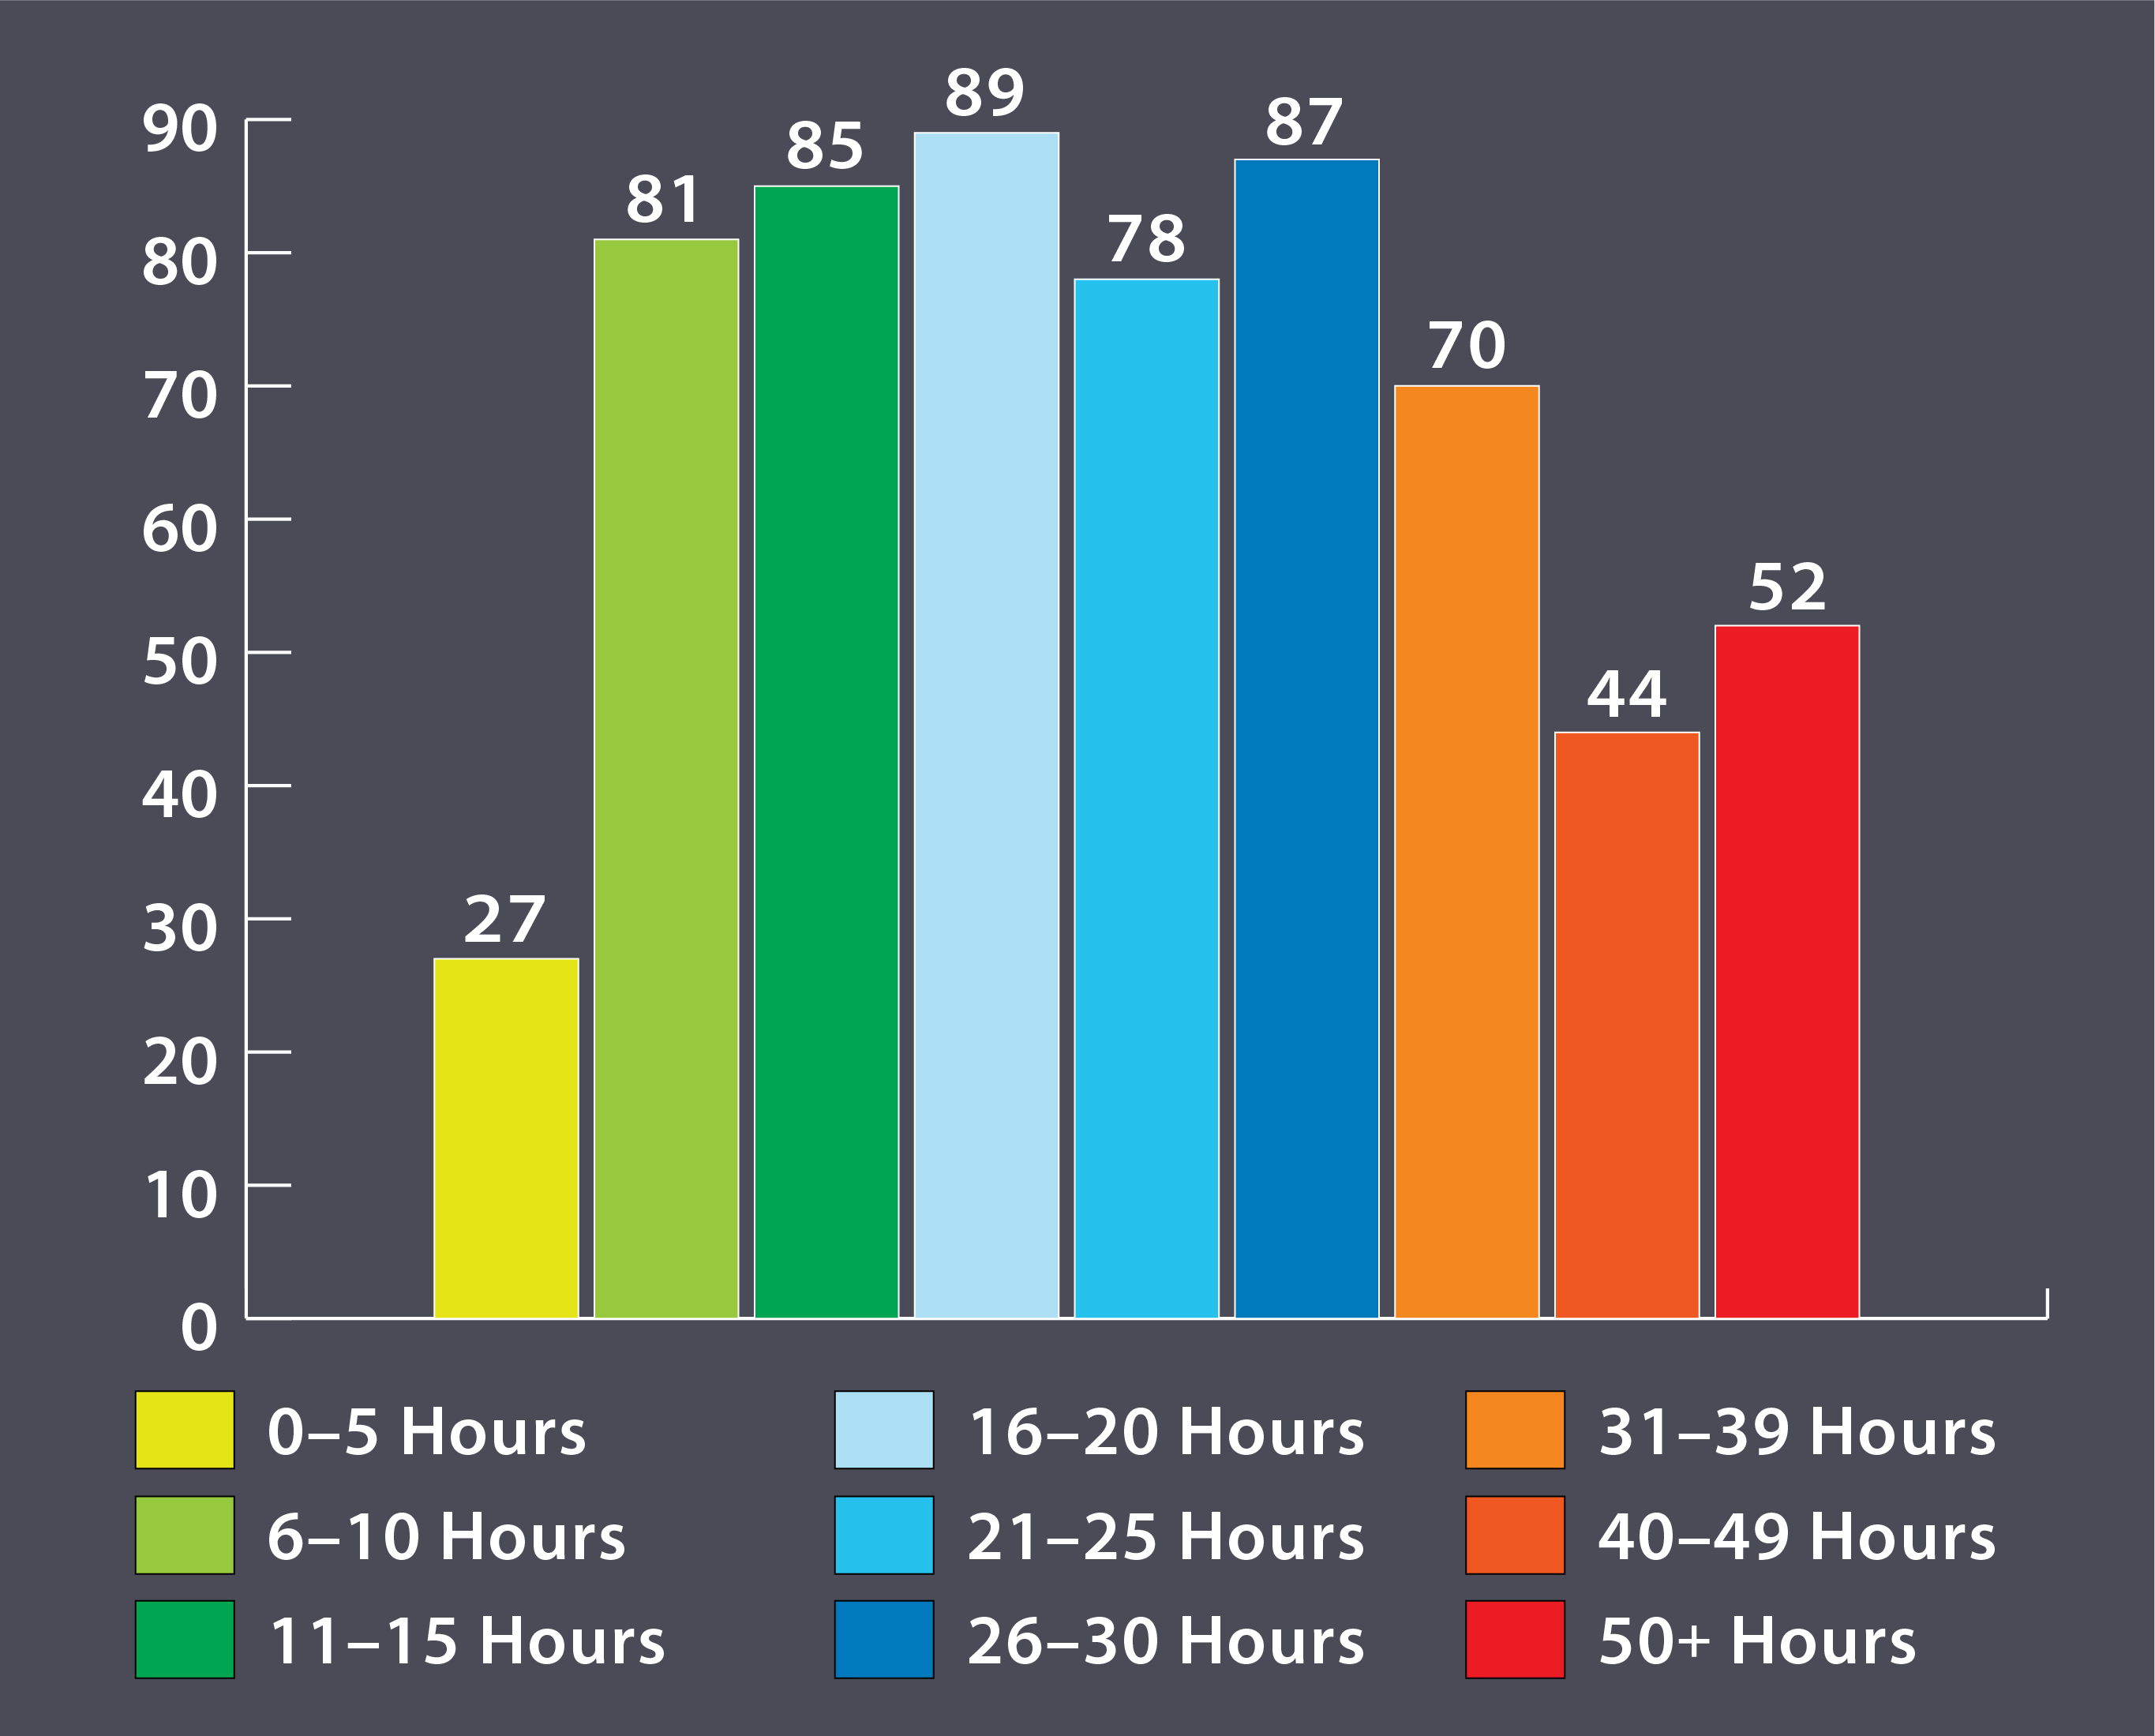
When asked how often they used a computer: 193 participants claimed 15 hours or less during an average week; 254 participants claimed between 16 and 20 hours during an average week; and 166 participants claimed over 30 hours a week (see Figure 3.6 for more details).
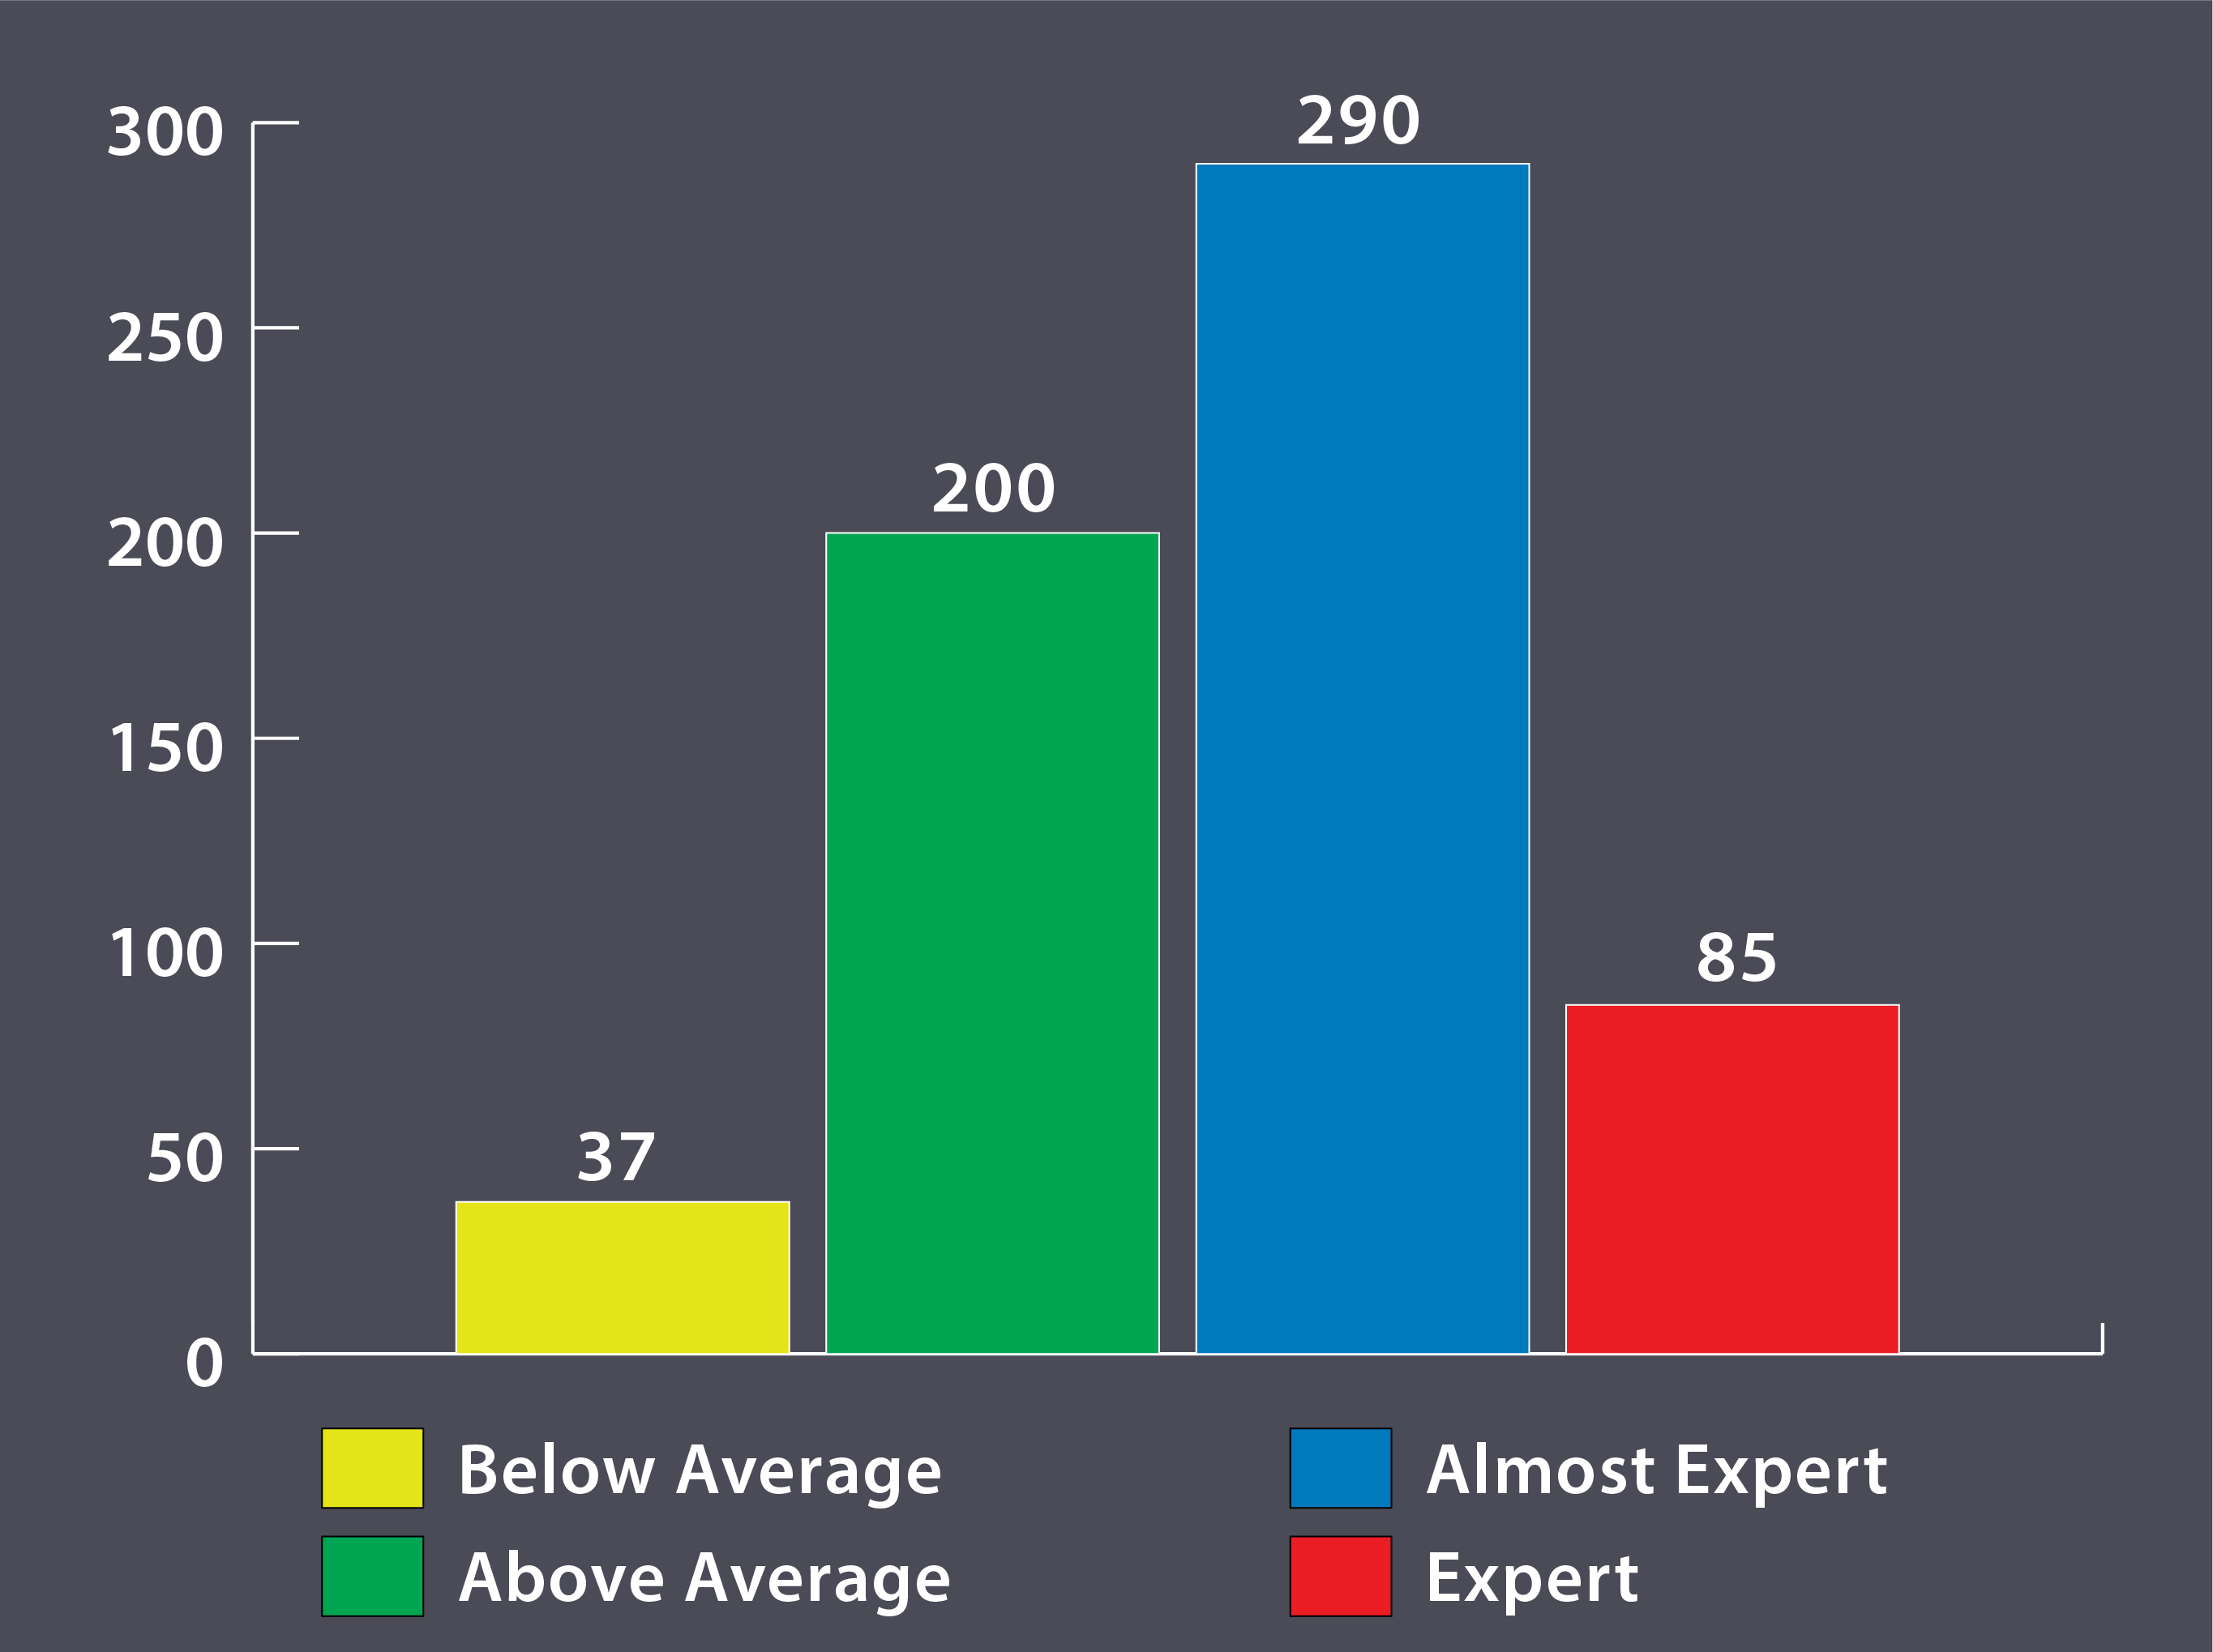
The participants also had the opportunity to self-rank their own levels of expertise using a computer on a scale of 0 (beginner) to 5 (expert). Out of the 612 participants who answered the question (see Figure 3.7): 37 participants self-identified as Below Average (a response of 0, 1, or 2); 200 participants self-identified as Above Average (a response of 3); 290 participants self-identified as Almost Experts (a response of 4); and 85 participants self-identified as Expert computer users (a response of 5).
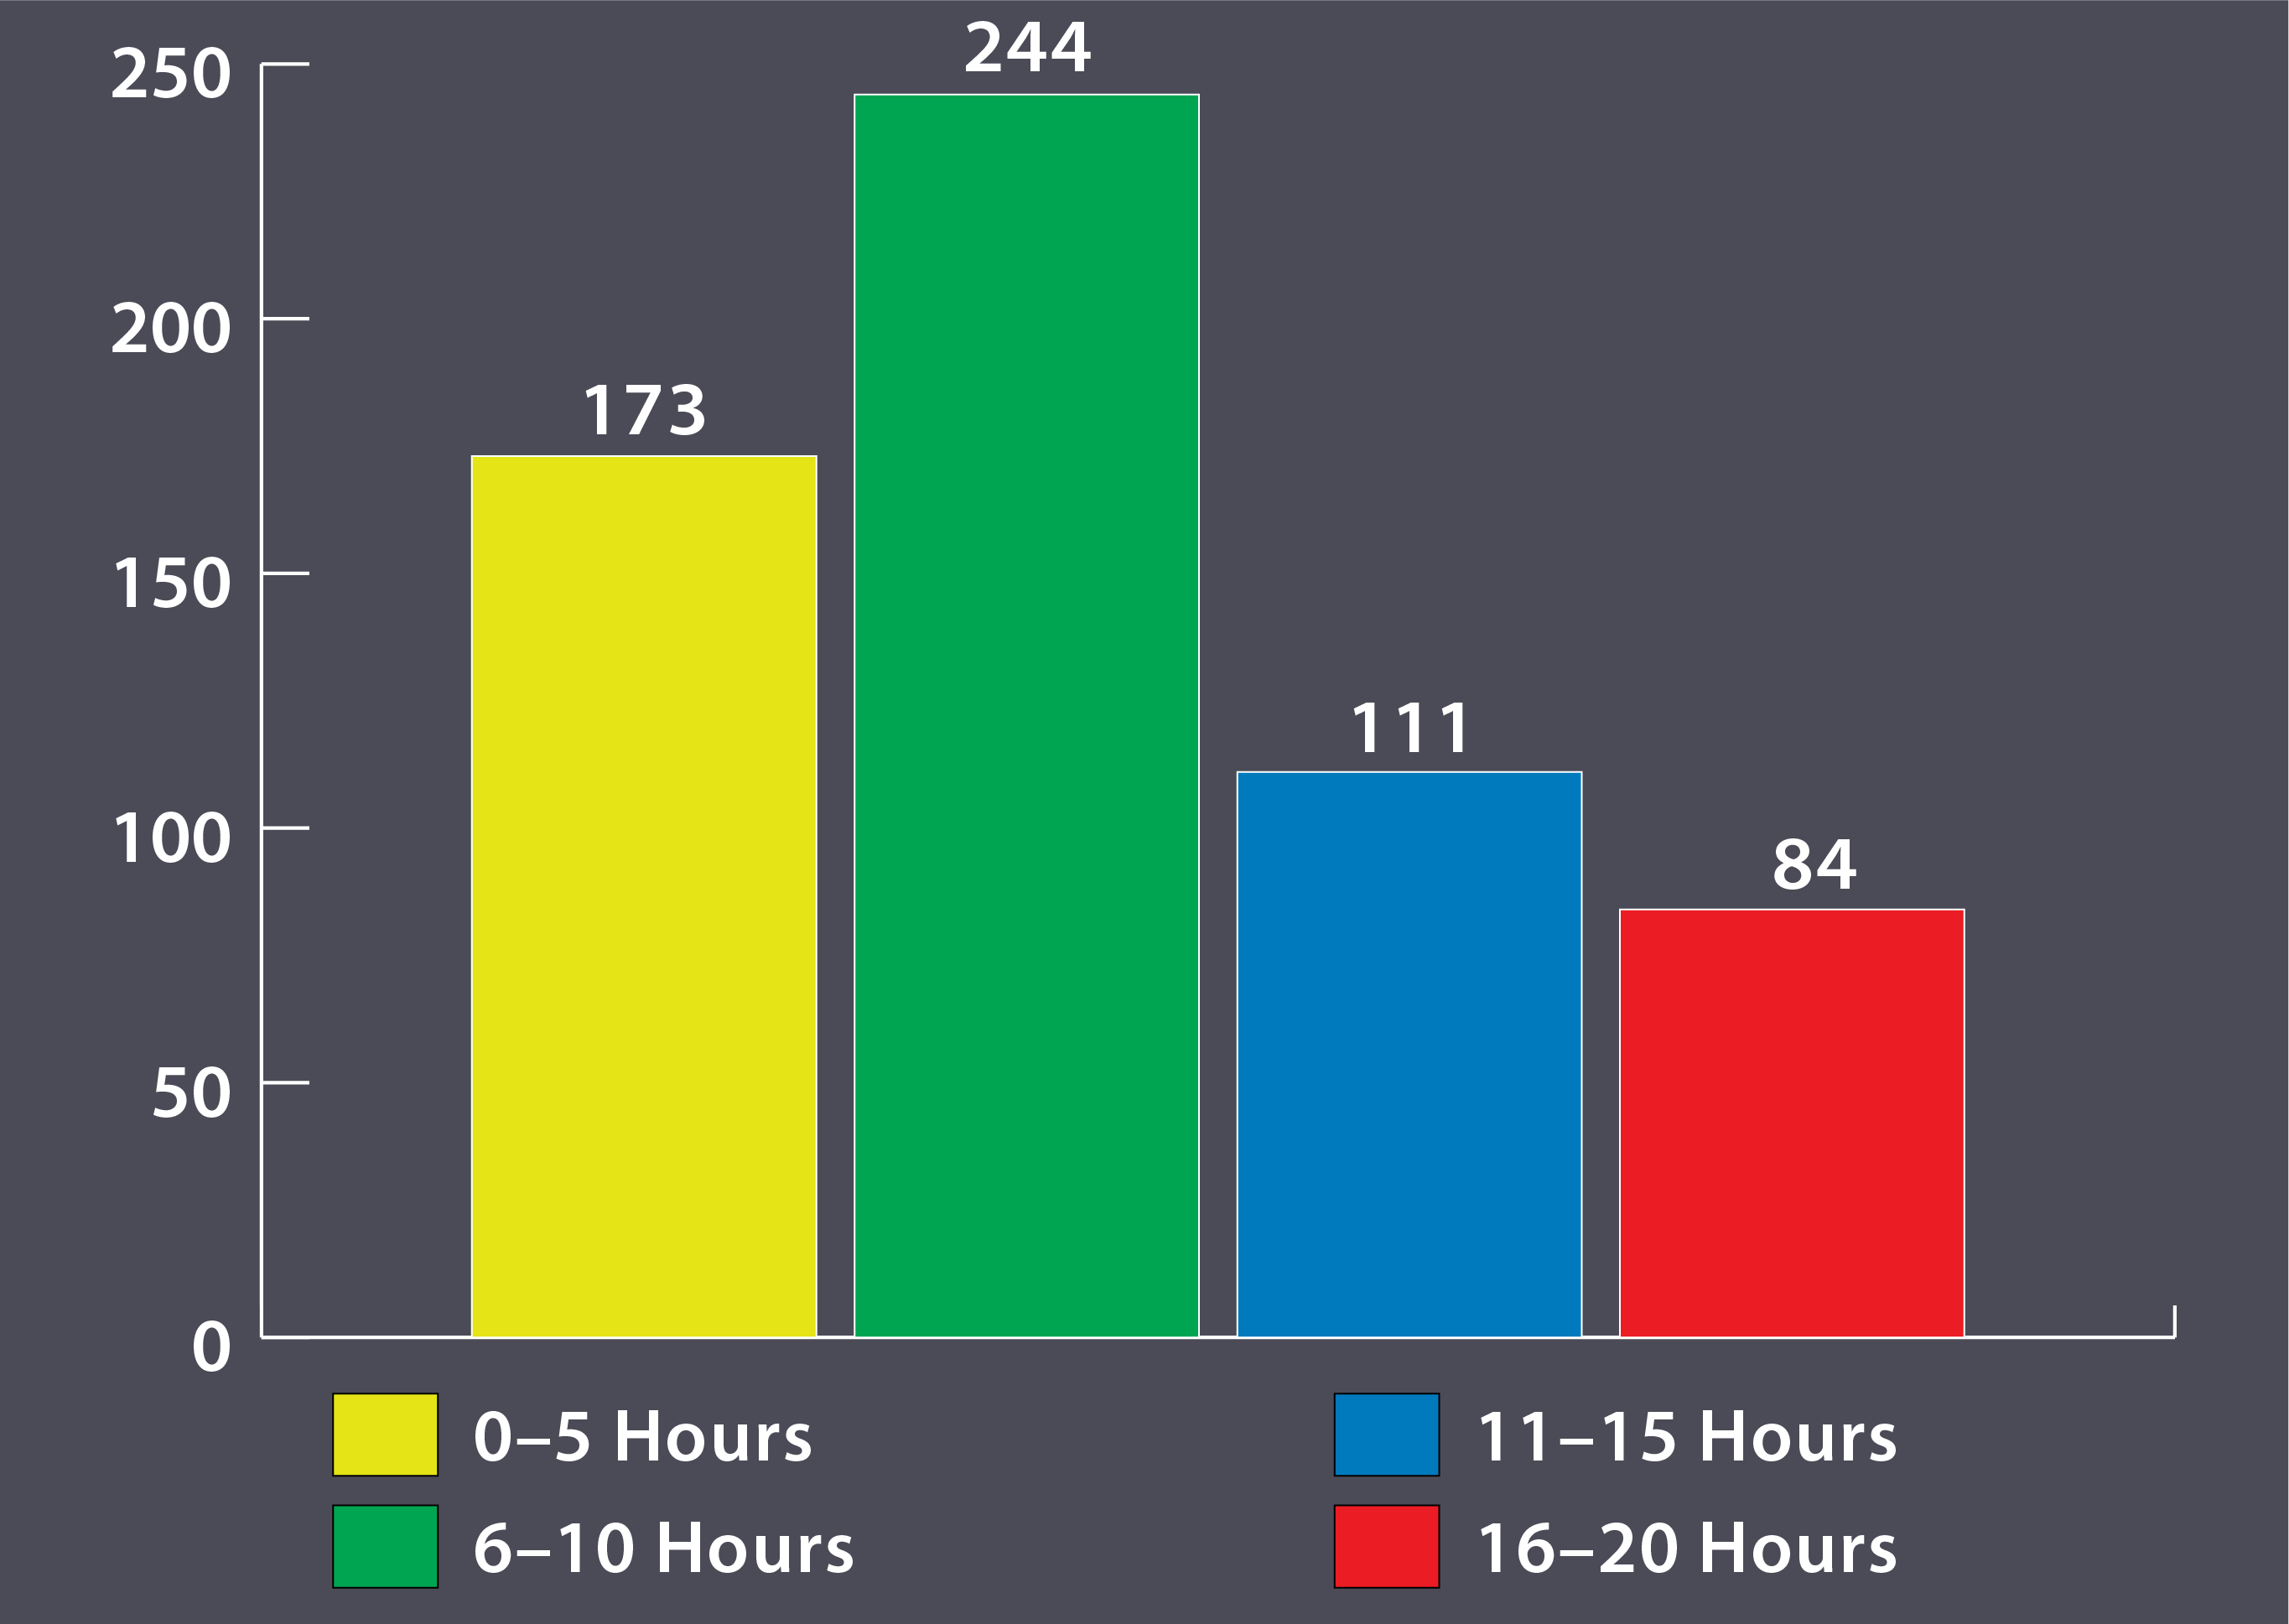
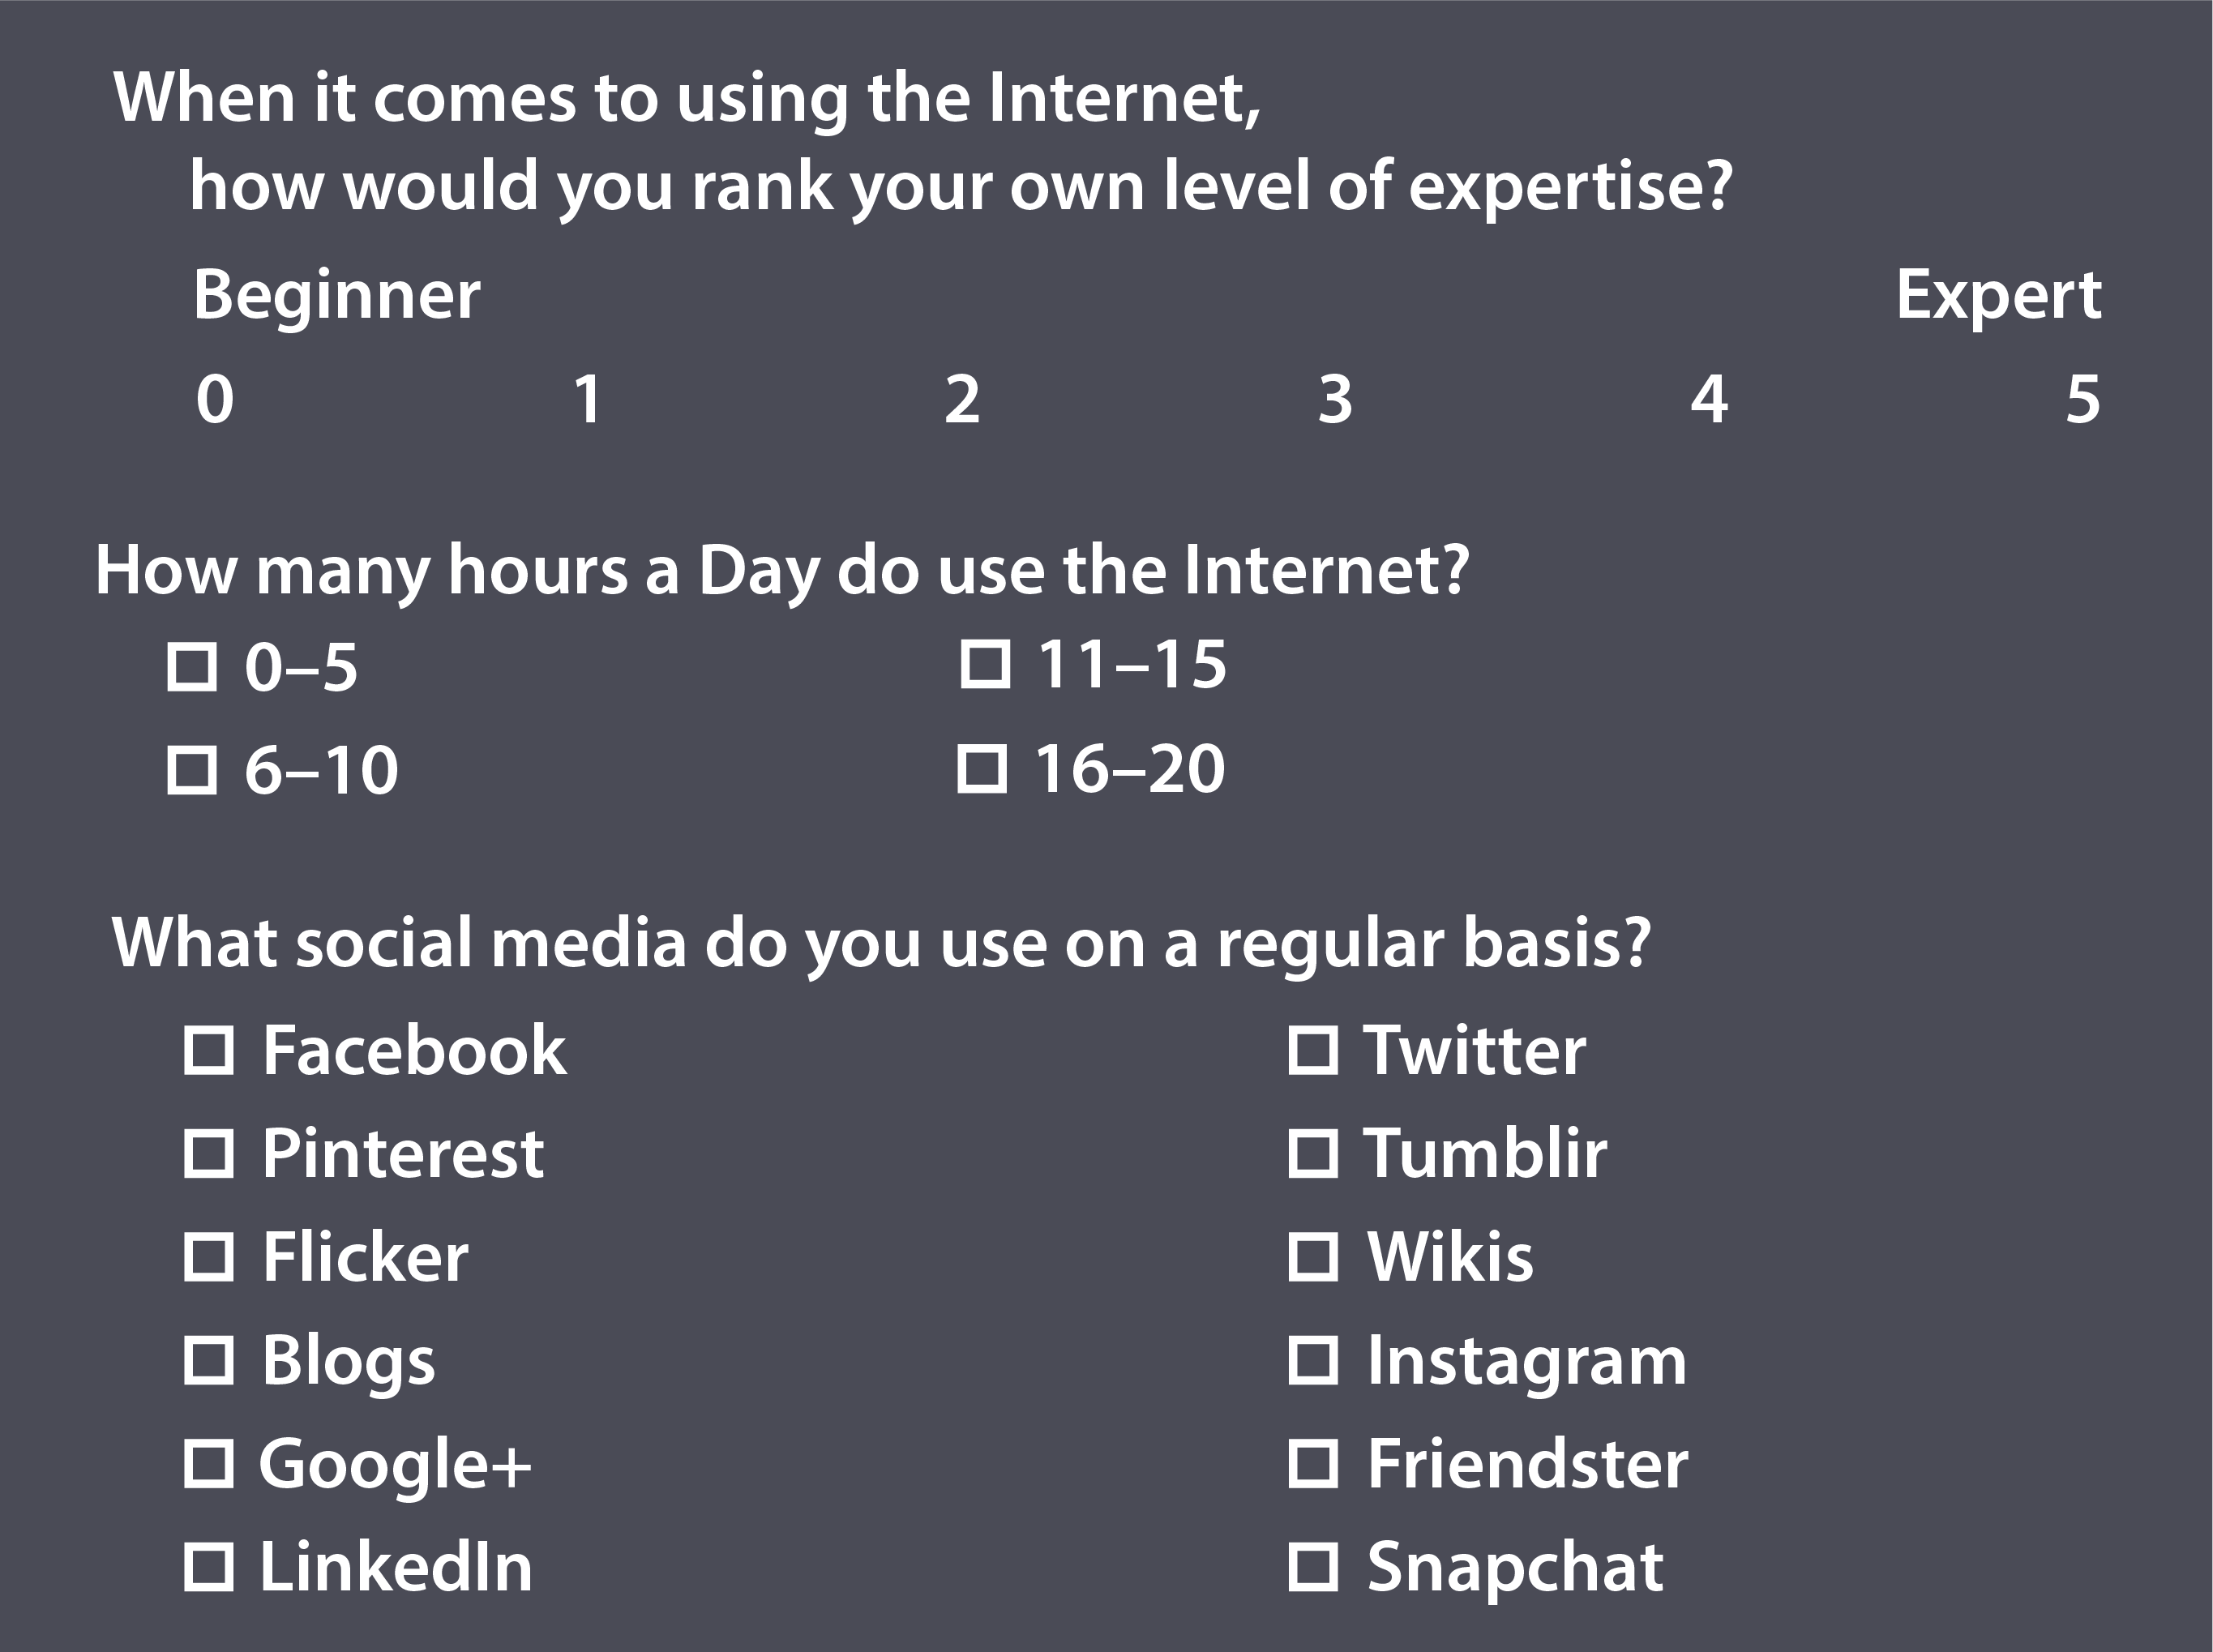
Like the questions related to using a computer, participants were asked how much time they spent using the Internet every day. Out of the 612 participants who answered the question (see Figure 3.8): 173 claimed five hours or less; 244 claimed between six and ten hours; 111 claimed between 11 and 15 hours; and 84 claimed between 16 and 20 hours.
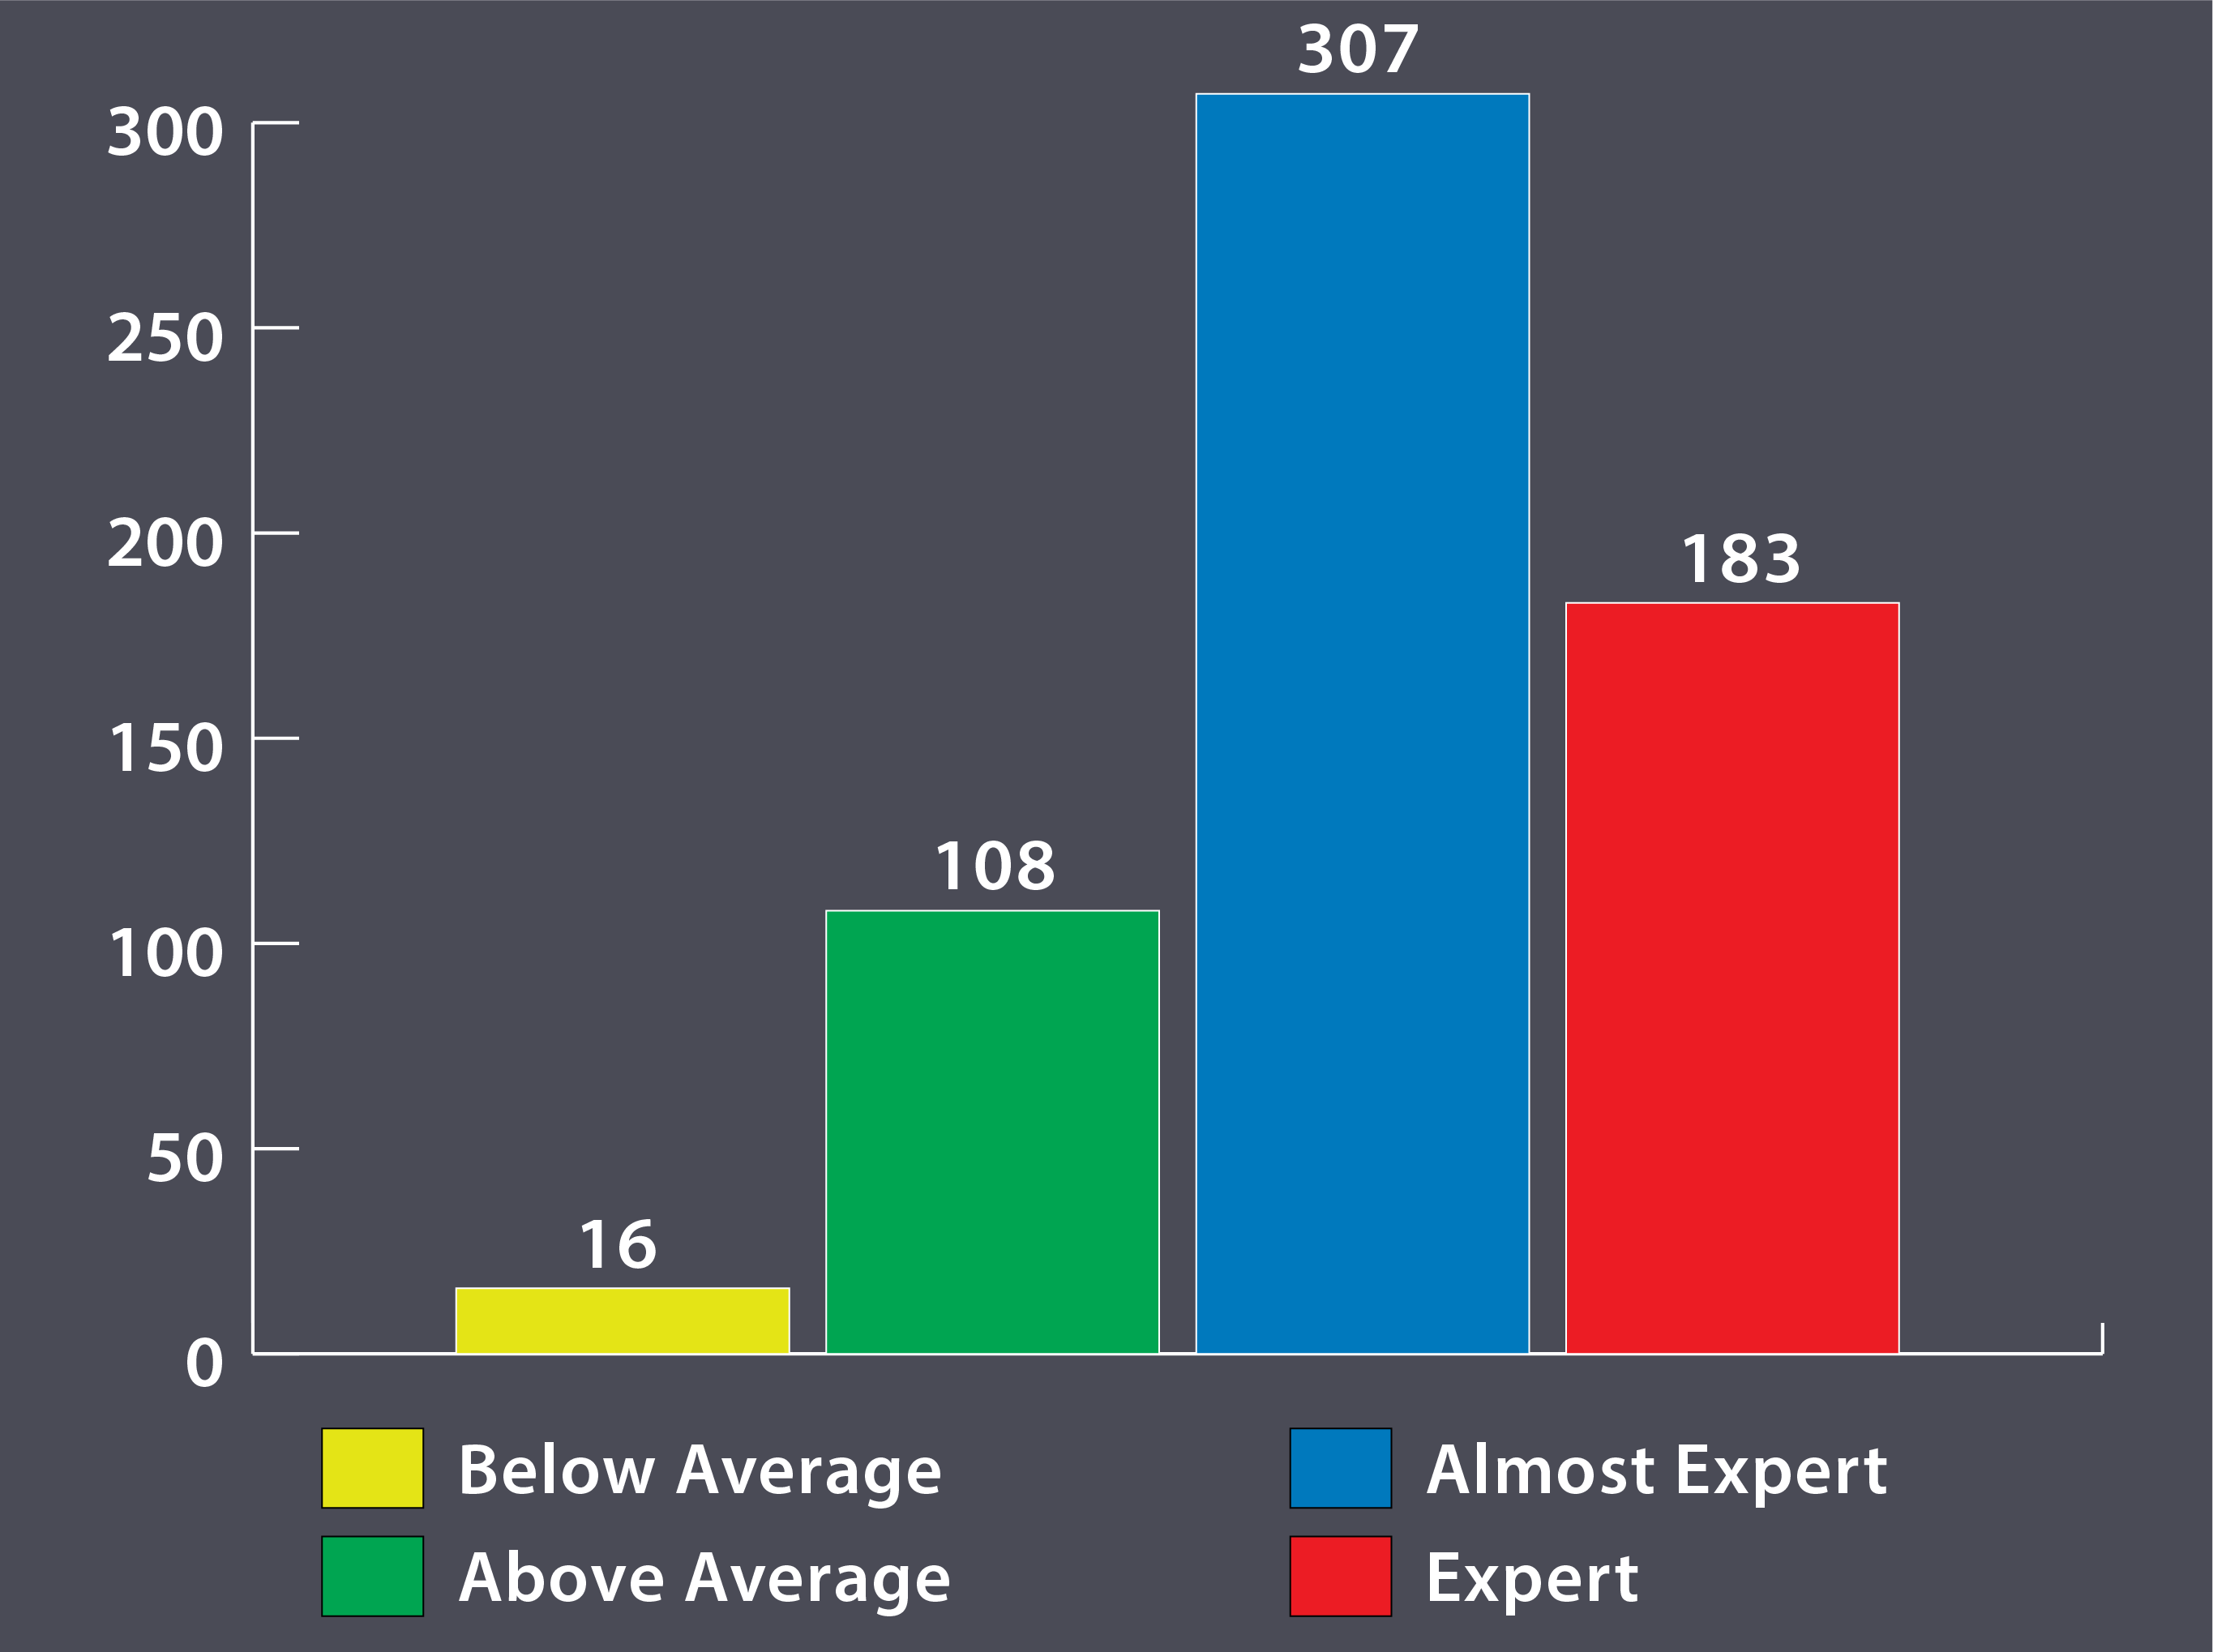
When asked to self–rank their own levels of expertise using the Internet (see Figure 3.9) on a scale of 0 (beginner) to 5 (expert): 16 participants self-ranked as below average users (a response of 0, 1, or 2); 108 participants ranked themselves as above average users (a response of 3); 307 participants ranked themselves as almost expert users (a response of 4); and 183 participants ranked themselves as experts (a response of 5).
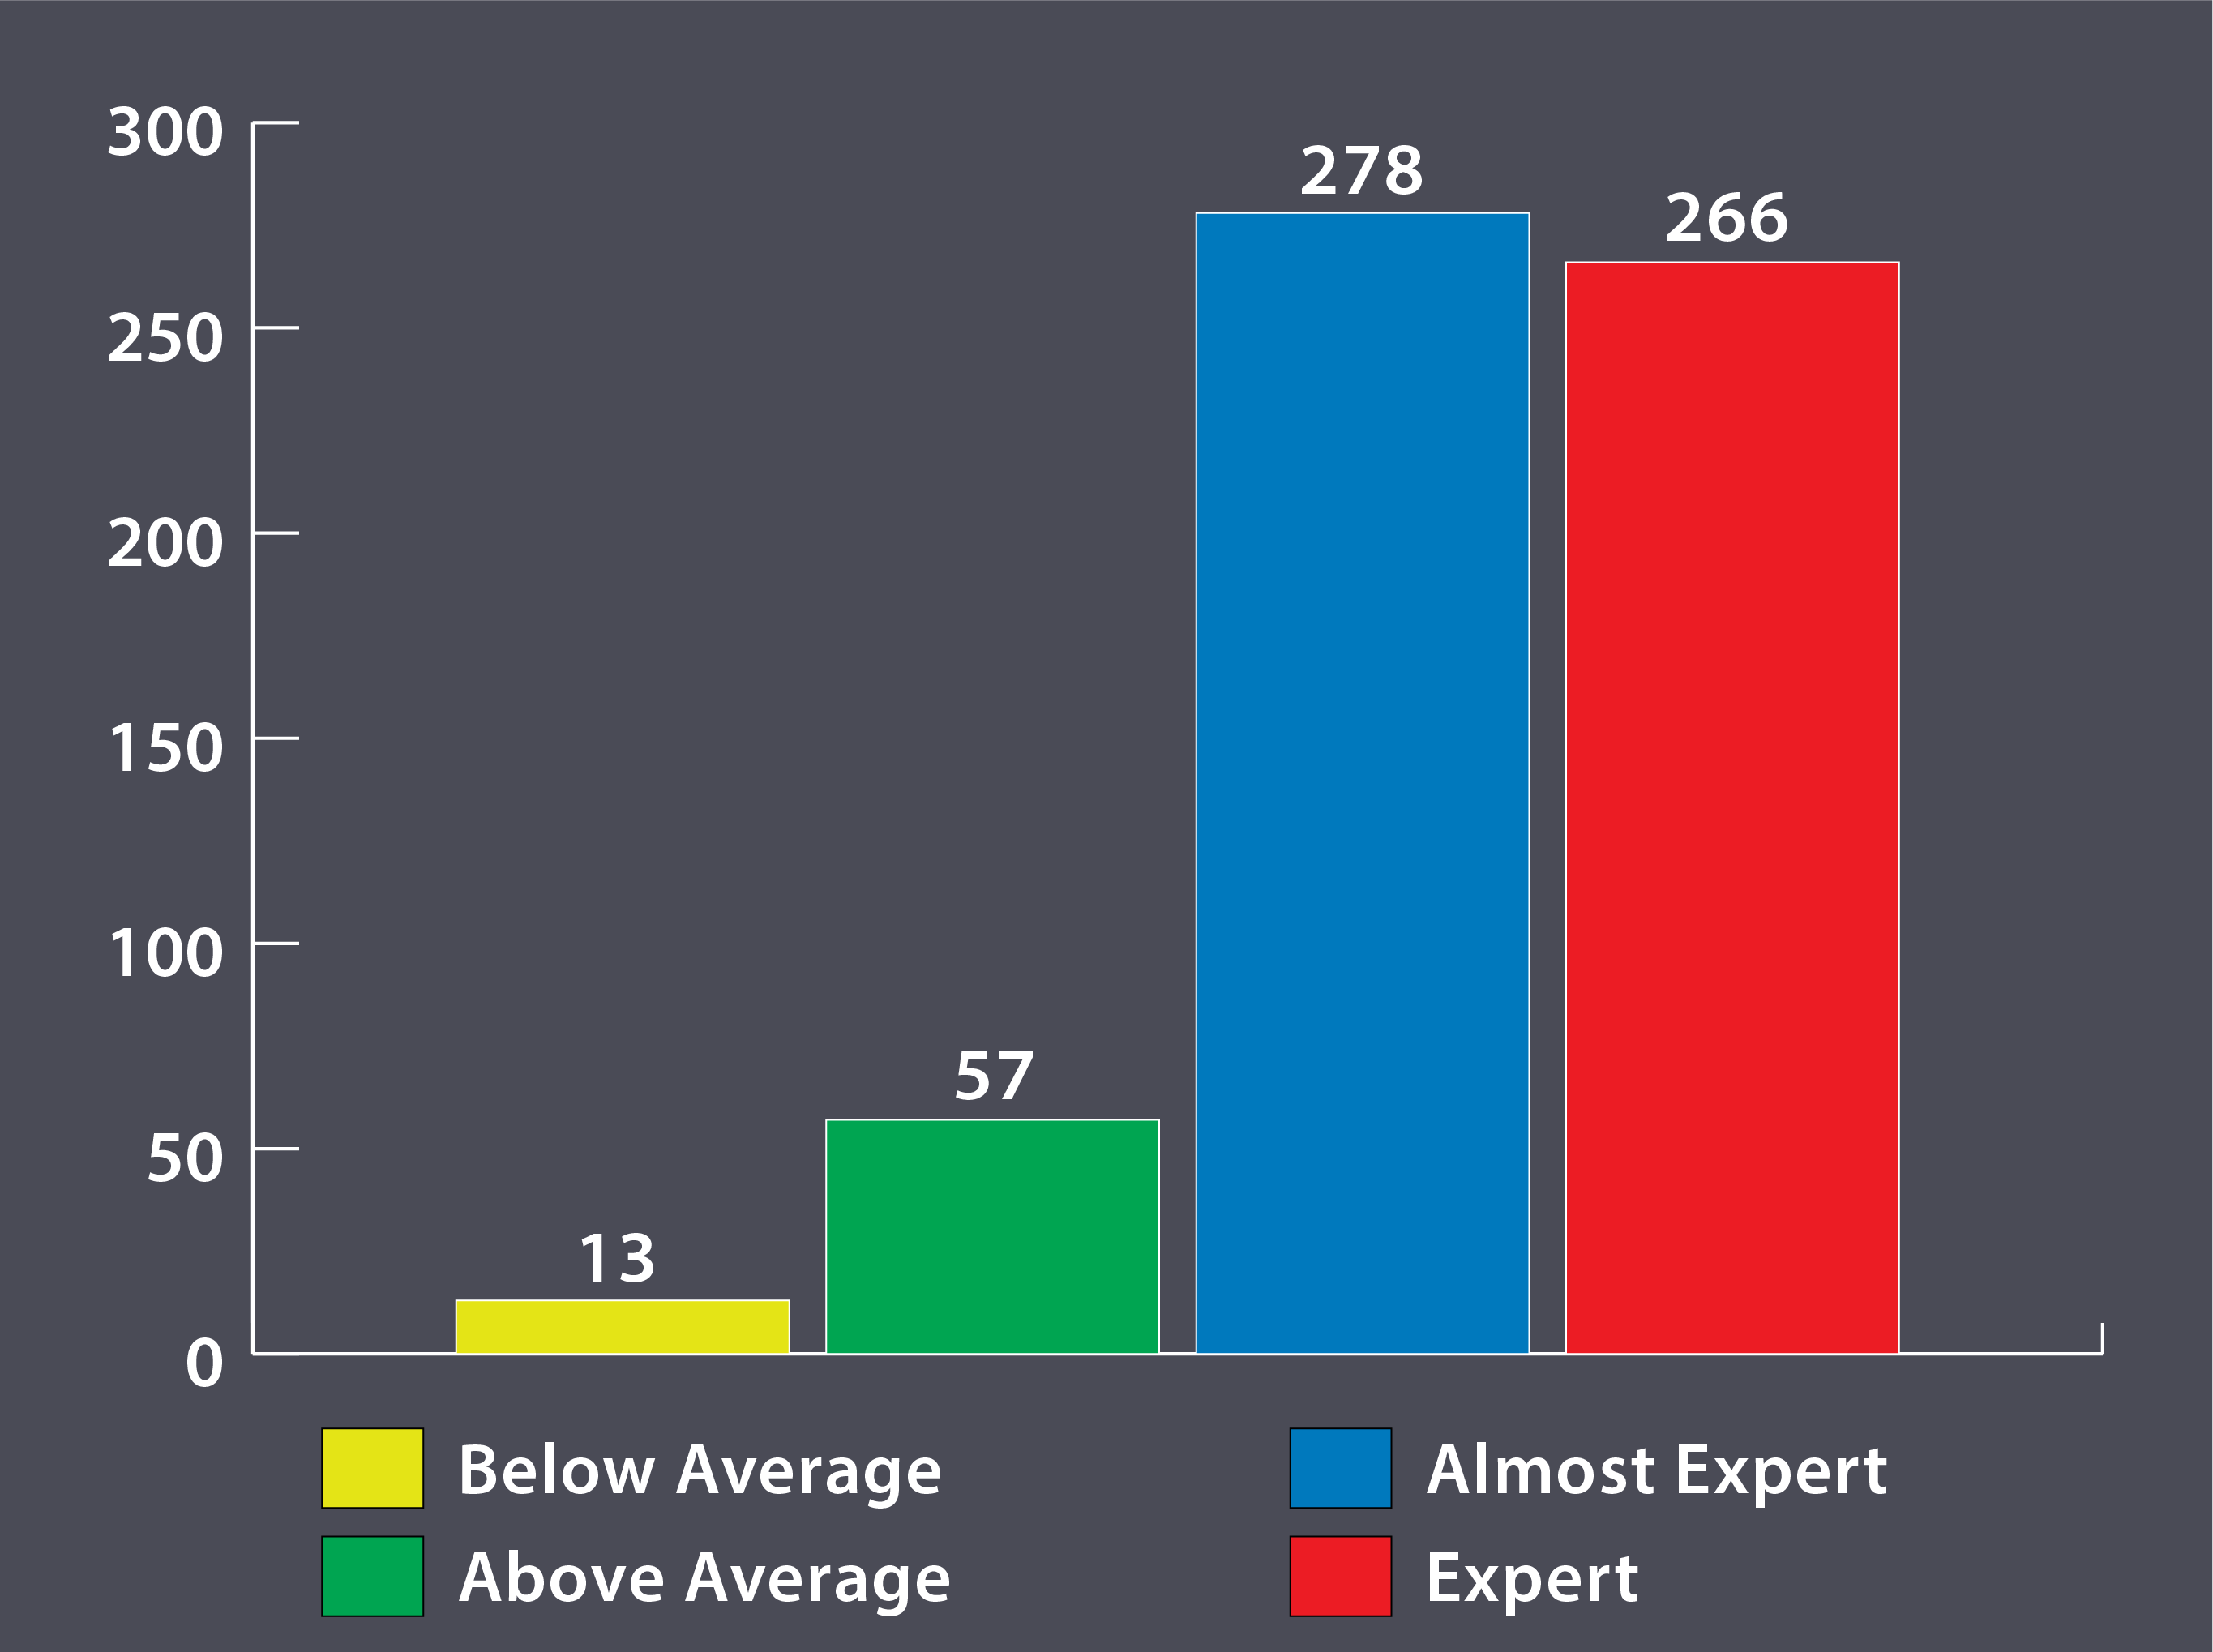
One additional question I asked pertaining to using some common digital composition technologies focused on smartphone use. Like the computer and Internet related questions, study participants were asked to self-rank their own levels of expertise using a smartphone (see Figure 3.10) on a scale of 0 (beginner) to 5 (expert).
All of the participants provided an answer to the question and according to the data: 13 participants self-ranked as below average users (a response of 0, 1, or 2); 57 ranked themselves as above average users (a response of 3); 278 participants ranked themselves as almost expert users (a response of 4); and 266 participants ranked themselves as experts (a response of 5).
3.4 Digital/Multimodal Content Production
While access, exposure, and gauging the participants’ own perceptions of expertise were all important aspects of my study, I also wanted to try and understand what types of activities the participants were completing using a computer, the Internet, and/or a smartphone. I wanted to know if the participants were composing texts
with the identified technologies or were more likely to engage in passive activities like watching YouTube videos.
In an attempt to understand how the participants were using computers, the Internet, and/or smartphones, I asked them two multiple-answer, multiple choice questions:
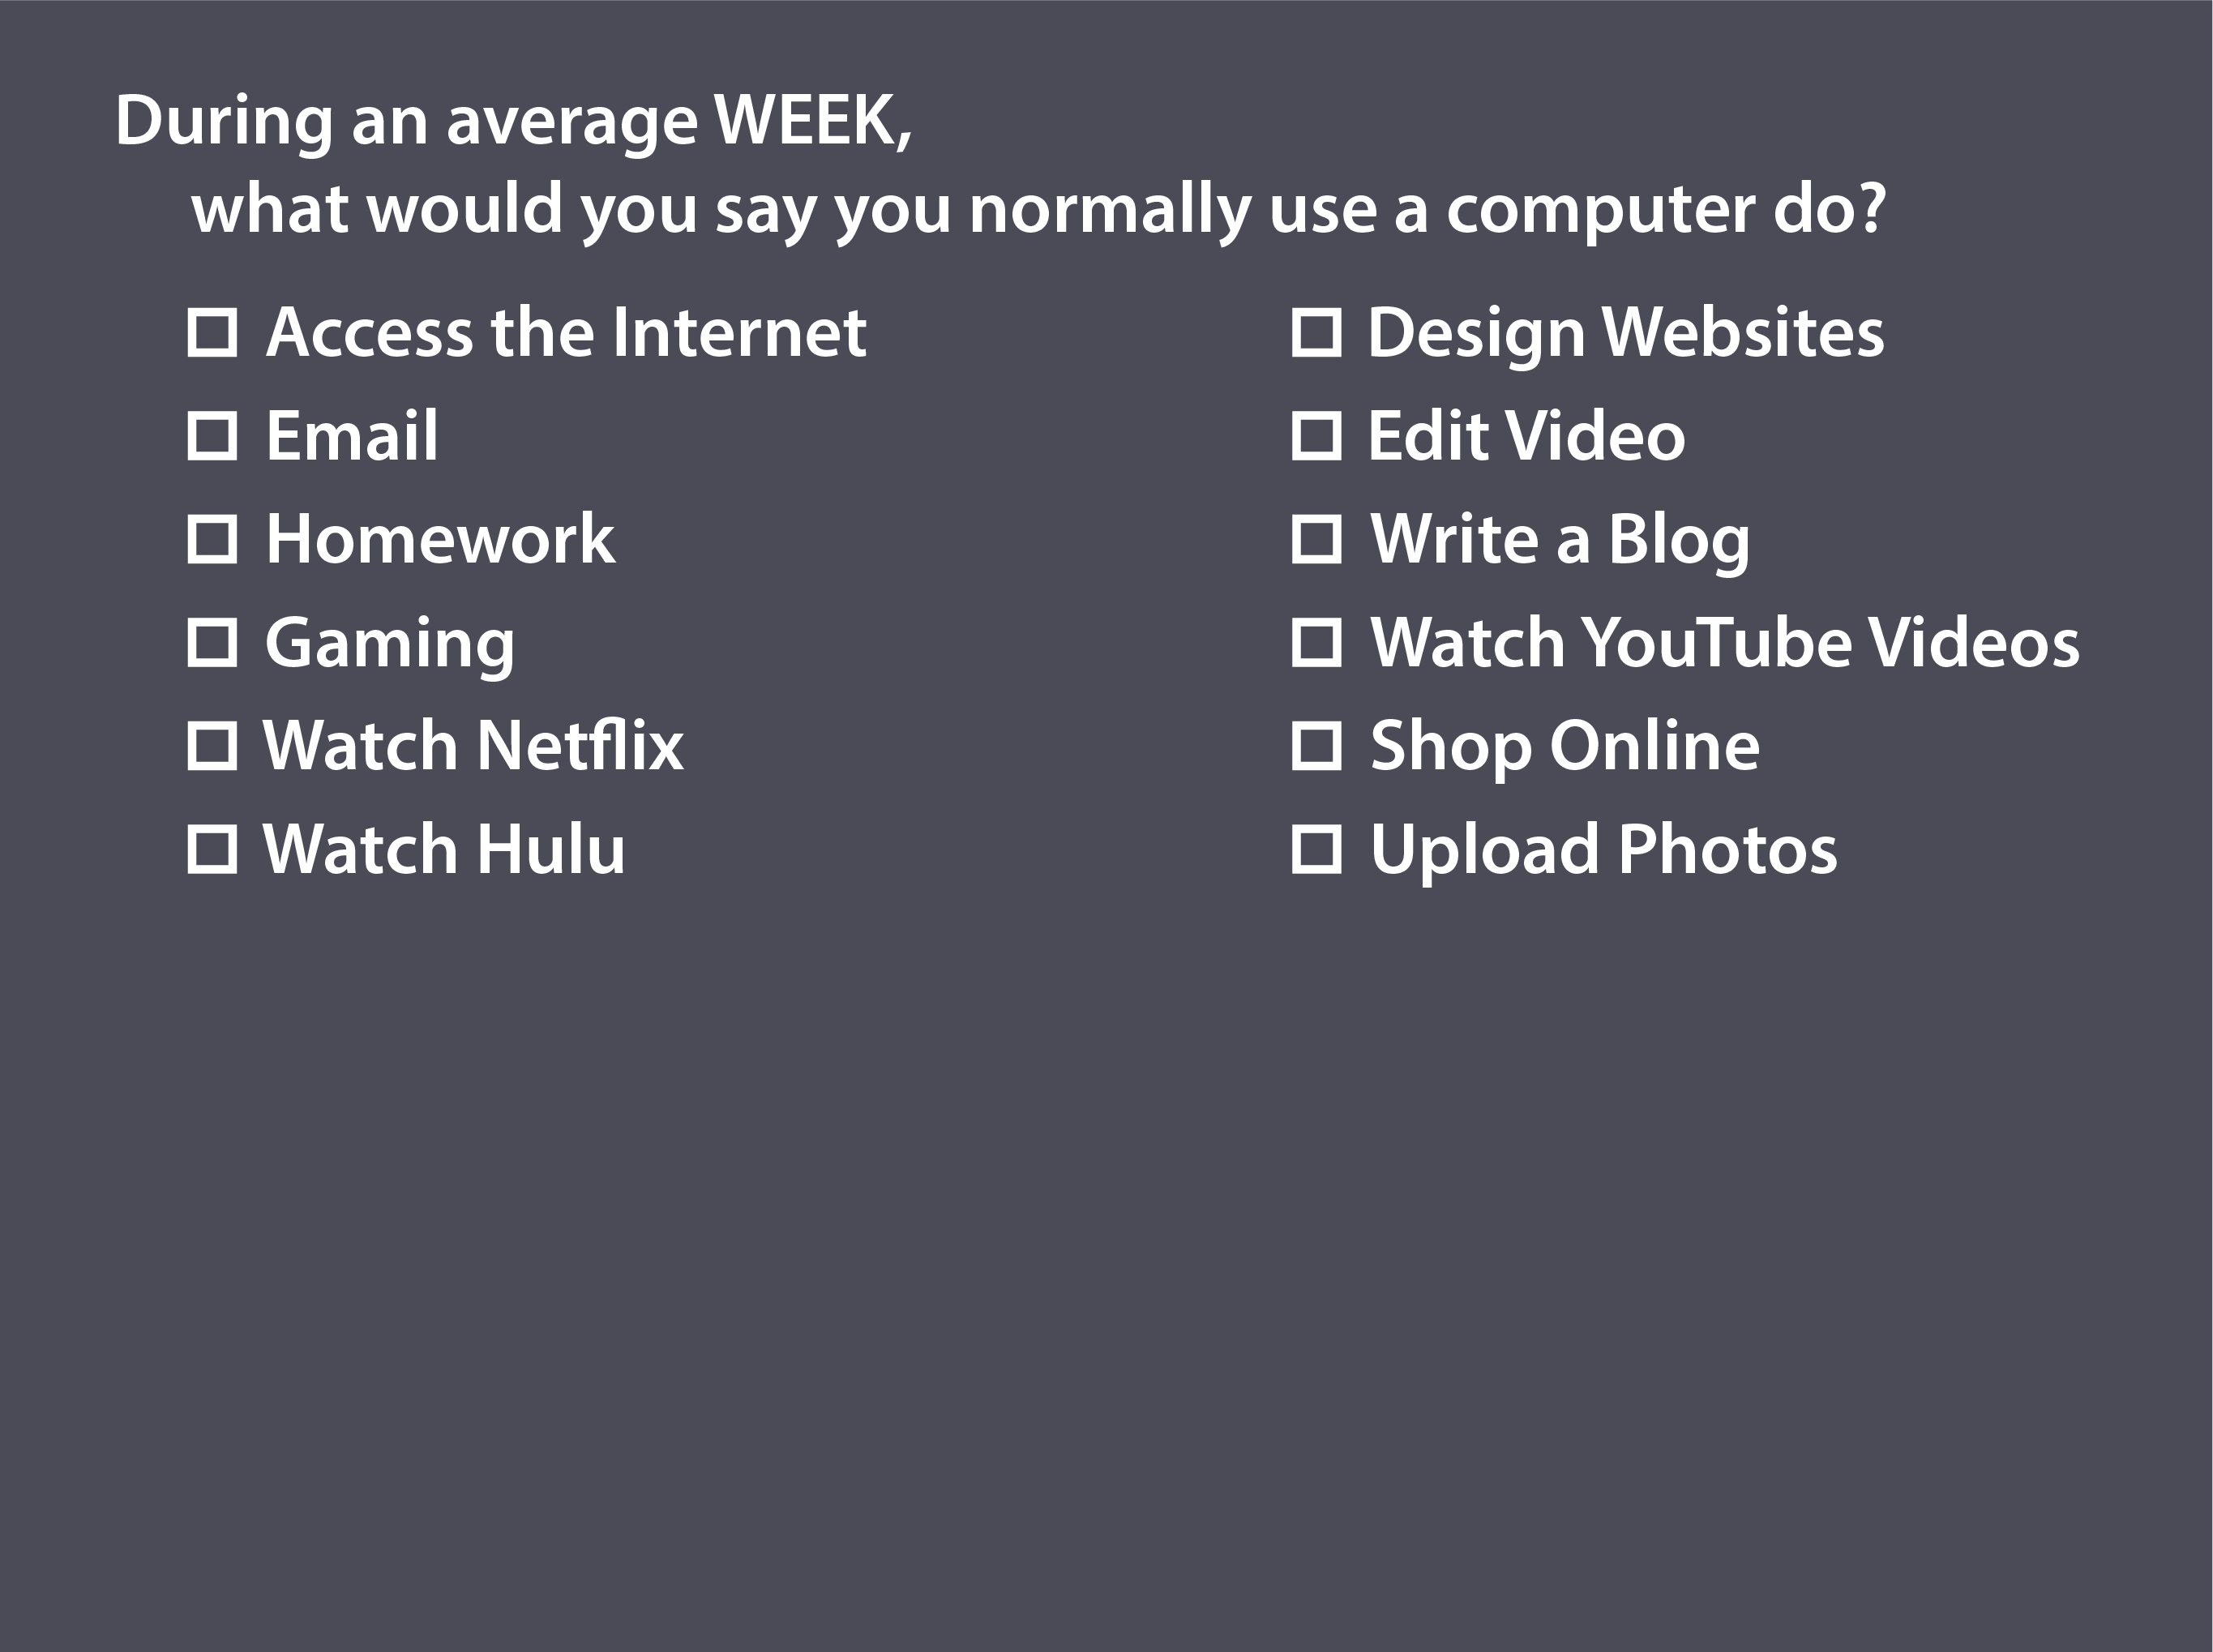
- During an average WEEK, what would you say you normally use a computer to do?
- What social media do you use on a regular basis?
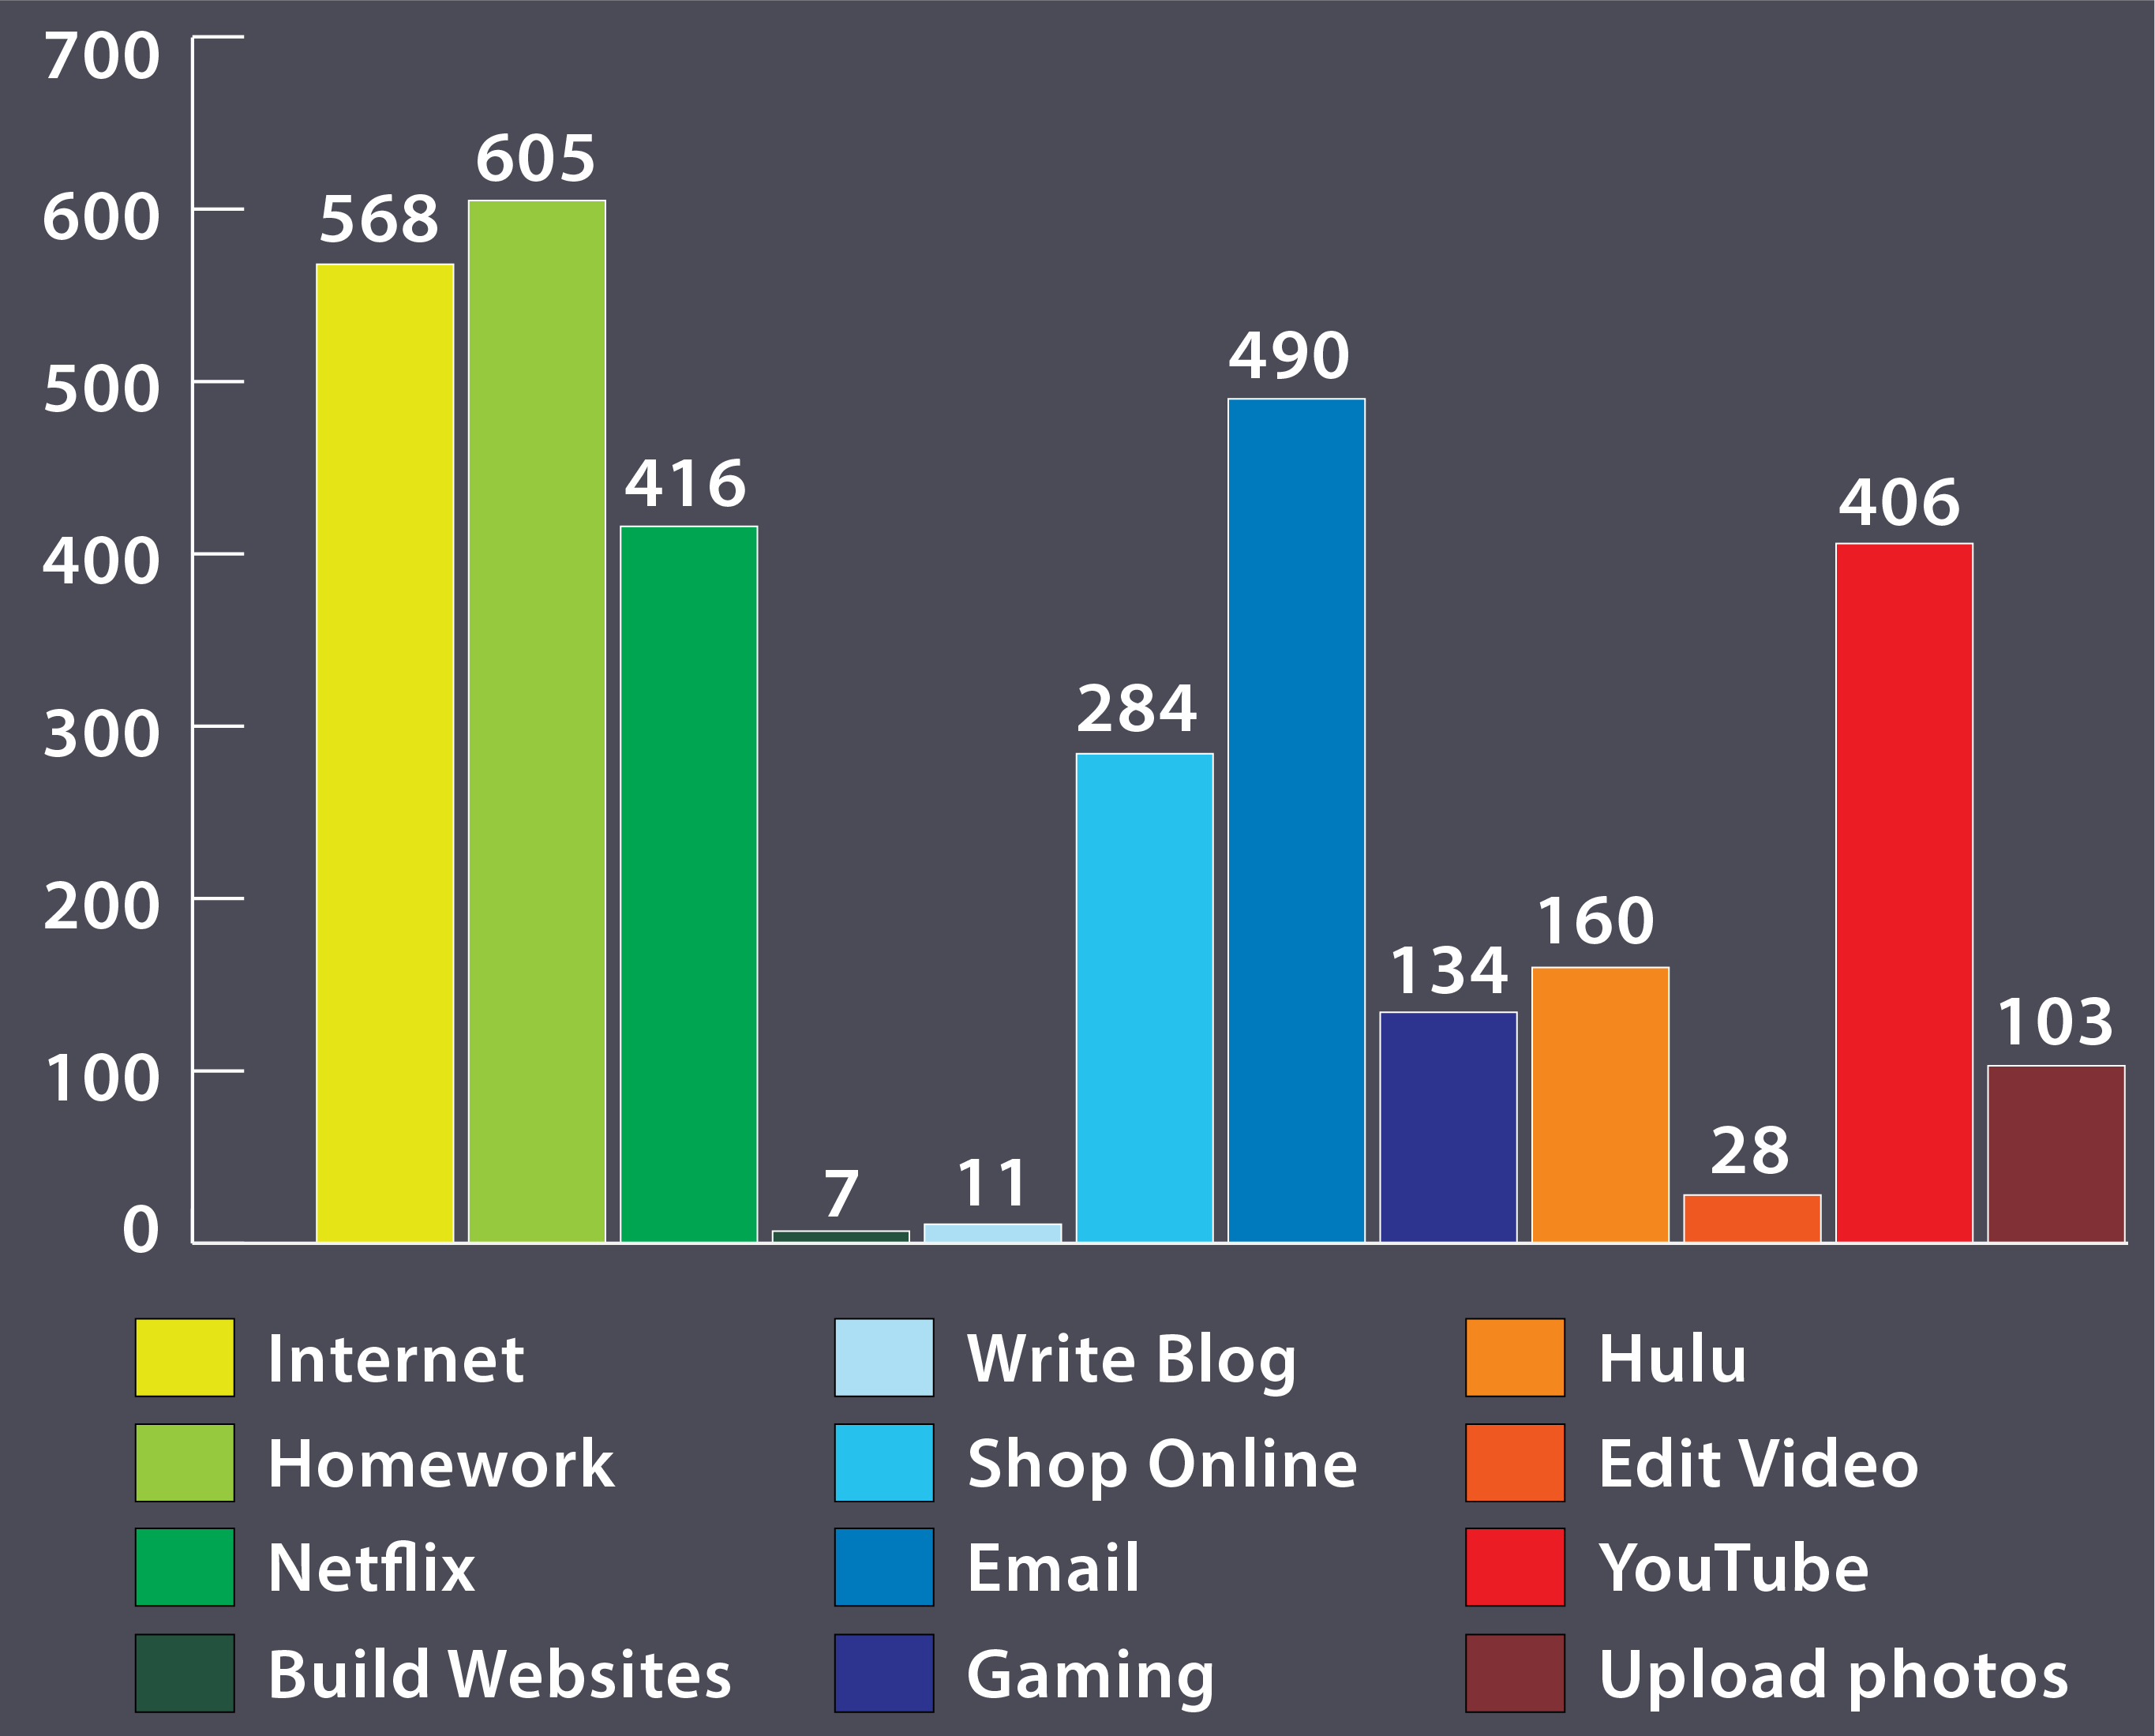
As Figure 3.11 illustrates, outside of writing emails, the participants were overwhelmingly more likely to use a computer to digest information than they were to create their own content. Only seven of the participants claimed to build websites regularly, 11 claimed they regularly blogged, and 28 claimed they regularly edited video.
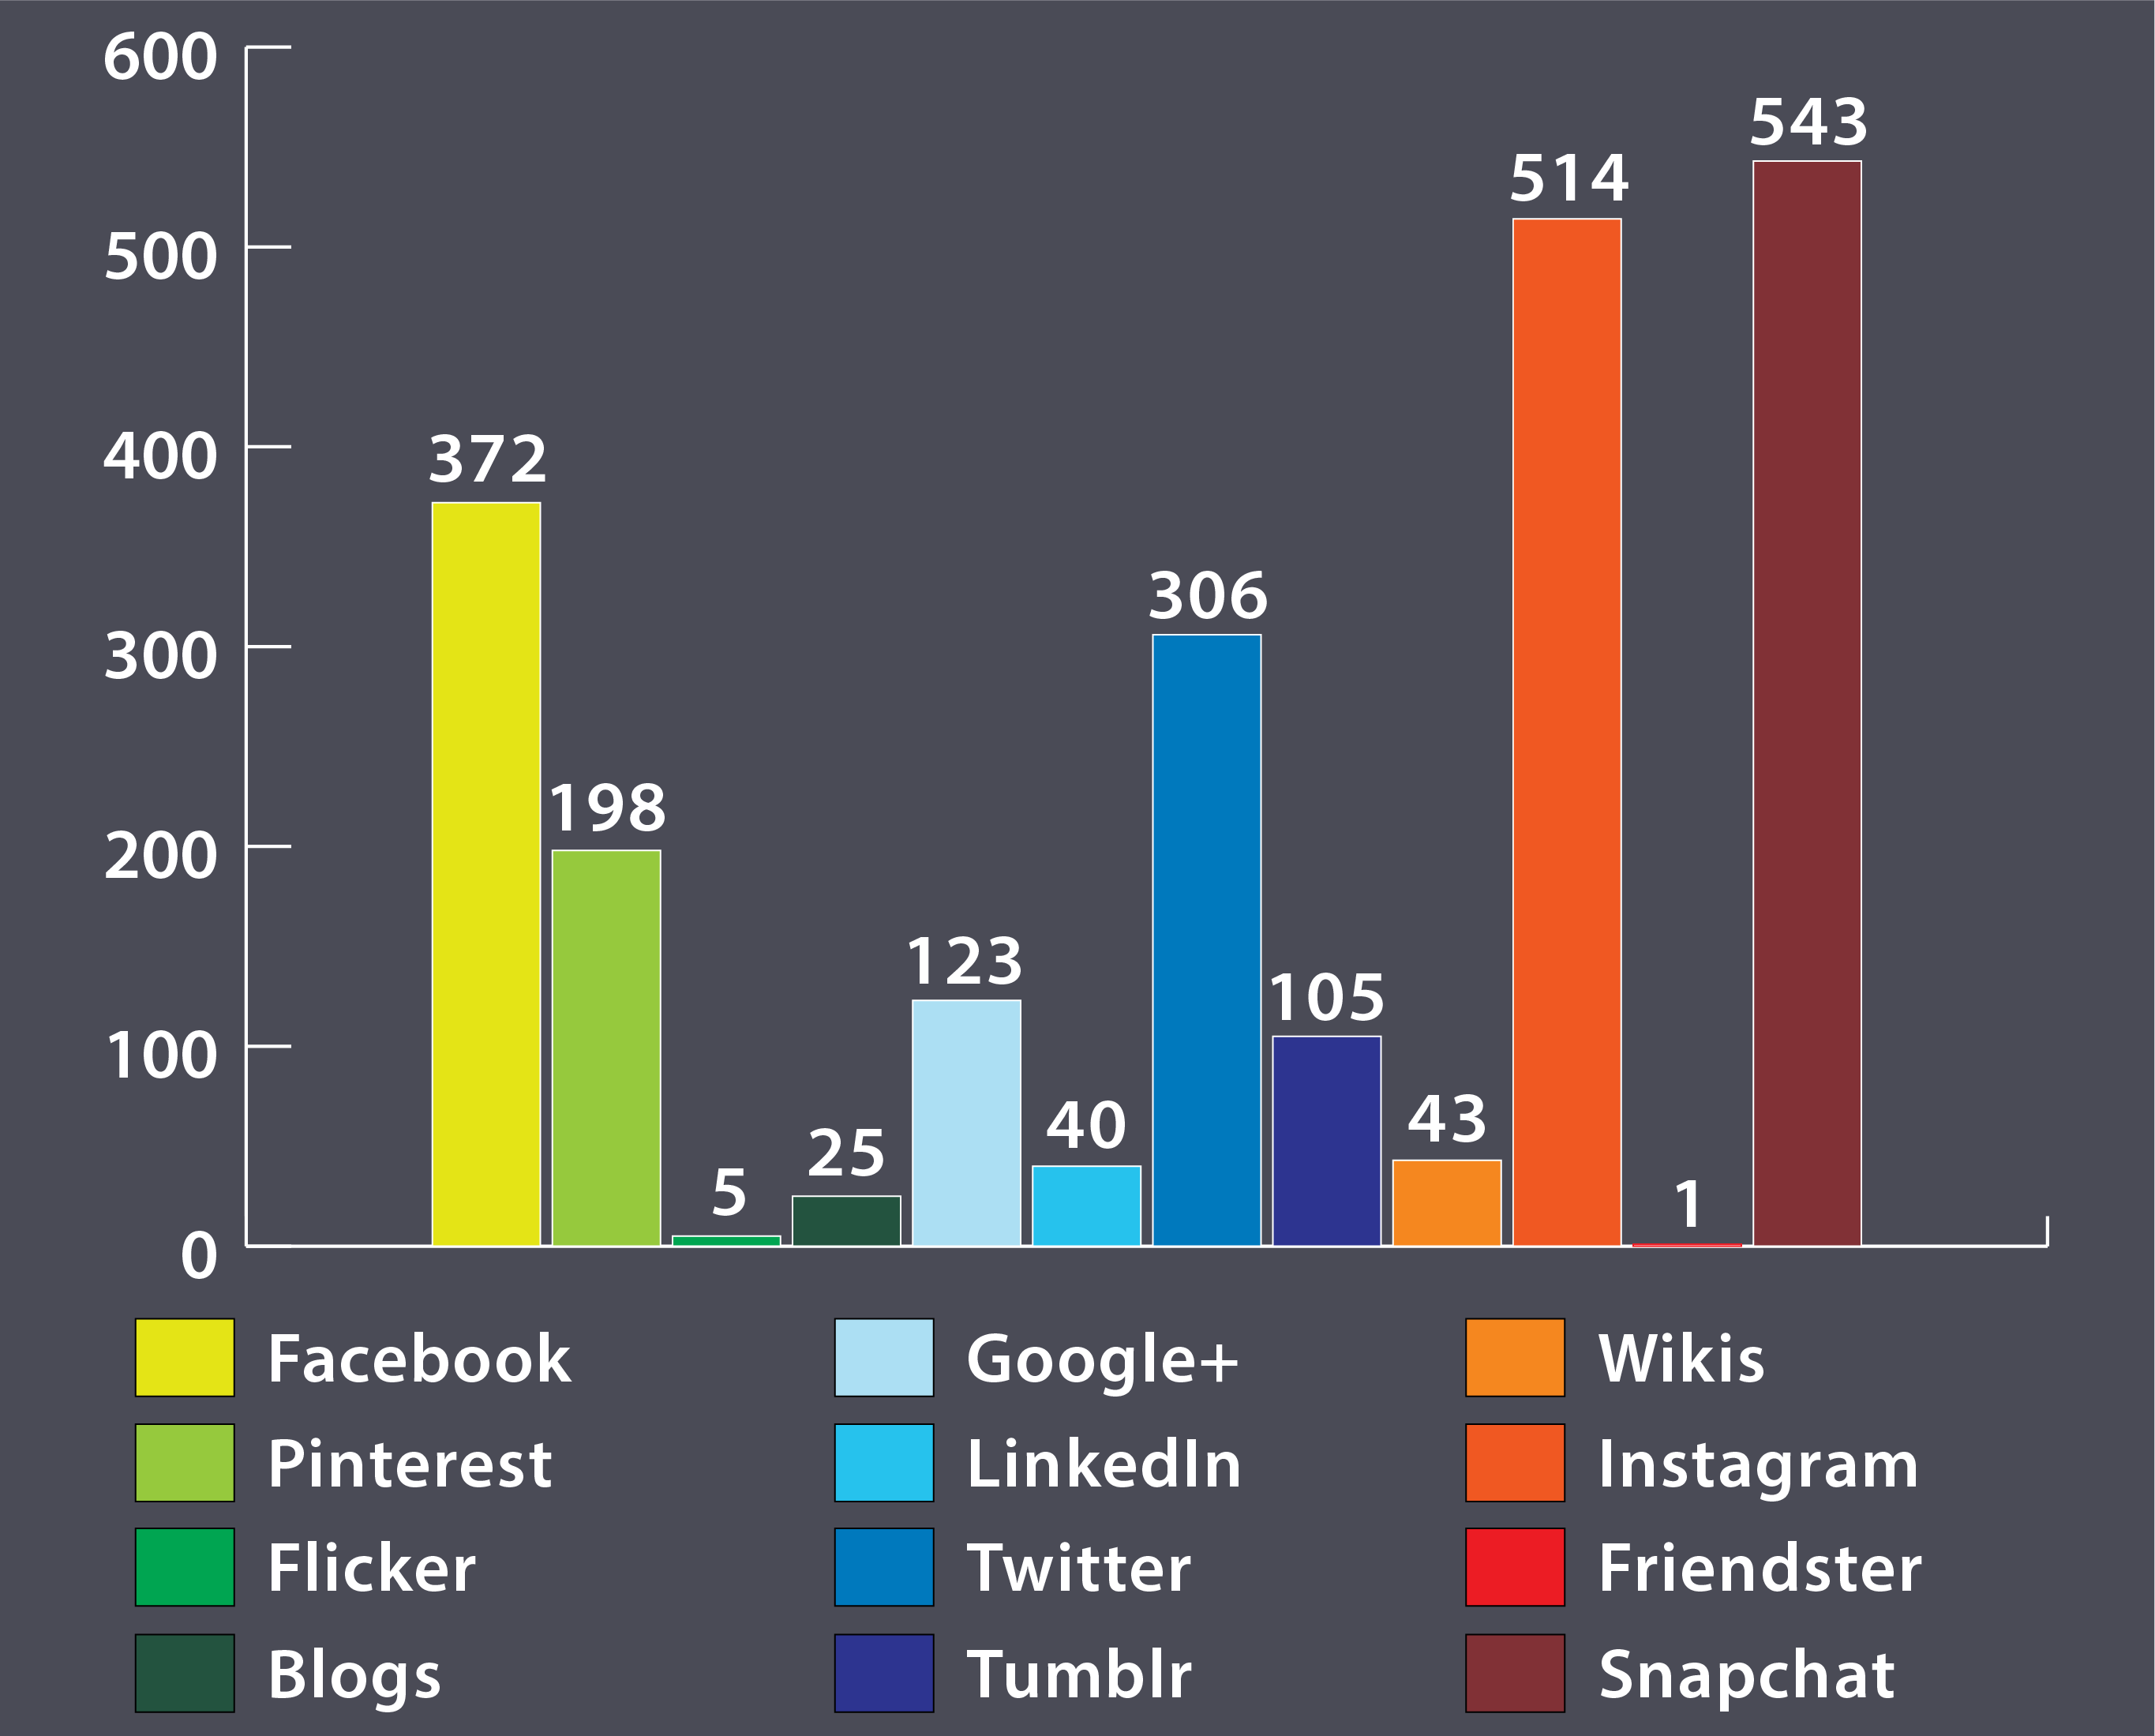
When asked about social media use, a large number of the participants claimed they belonged to social media platforms that are based on sharing some form of multimodal content. As shown in Figure 3.12, 514 participants out of the 596 who answered the social media question claimed they regularly use Instagram.
However, the participants were also less likely to regularly use social platforms where the content extends beyond their own social networks or followers. Based on the collected data, only 43 participants claimed they used wikis on a regular basis and only 25 claimed to use blogs on a regular basis. (Note: Data collected for this study was closed before TikTok became widely available.)
3.5 Implications
As the data above indicate, some of the participants in my study could very easily be labeled Power Users
when it comes to how they view their own level of expertise using a computer, the Internet, or a smartphone. However, that type of user does not really provide much guidance when attempting to build an accessible pedagogical approach to multimodal composition. Instead, the data I got from my participants at the other end of the spectrum proved much more informative.
First, access, or rather lack of prior access to certain technological tools, does seem to be an issue for a small percentage of the study participants. Discovering that eight participants in the study did not have access to a computer where they lived in high school is an important discovery on its own. However, all eight of those participants also indicated that they did not own a laptop computer while in high school, five of those participants also did own an iPad or tablet while in high school, and three of them also claimed they did not own a smartphone while in high school. Meaning, three participants did not have direct access to any of the technologies commonly used when building a purely digital multimodal composition while in high school.
Of the 193 participants (31% of the total) who claimed they used a computer less than 15 hours a week, 27 participants claimed they used a computer five hours or less and 81 participants claimed they used a computer between six and ten hours during an average week.
Second, time spent using the technology tools in question is also an issue among some of the study participants. Of the 193 participants (31% of the total) who claimed they used a computer less than 15 hours a week, 27 participants claimed they used a computer five hours or less and 81 participants claimed they used a computer between six and ten hours during an average week.
In addition, 447 or roughly 73% of the participants claimed they used the Internet less than 10 hours in an average week. This is not a surprising number given the fact that most social networks and many of the most popular websites now have dedicated smartphone applications, but it also means that doing Internet-based research or successfully finding free online assets that can be used in a multimodal project might be an unfamiliar activity for a large number of the study participants.
Finally, how some of the participants viewed their own level of expertise using a computer, the Internet, or a smartphone needed further consideration. Out of the 35 participants who self-ranked their own level of expertise using a computer as below average: one participant selected 0 and one participant selected 1. Out of the 16 participants who self-ranked their own level of expertise using the Internet as below average: two participants selected 1 and 14 selected 2. Out of the 13 participants who self-ranked their own level of expertise using a smartphone as below average: one participant selected 0, three participants selected 1, and nine participants selected 2.
Statistically speaking, some of the data I just shared might not seem very significant at first glance. Having only 6% of the participants self-rank themselves as below average computer users, for example, is a relatively small number. However, forcing those same participants to complete a moderately difficult multimodal project early in the semester might prove detrimental to their overall success in the course. In addition, what the numbers about self-ranked levels of expertise above indicate is that some of the study participants did view themselves as beginners when it comes to some very common tools used to build purely digital multimodal compositions.
In other words, to create a truly accessible semester-long, multipart, multimodal project, the first assignment needed to include a very low-bridge approach, to use Anderson’s (2008)7 term, to accommodate those participants, as I explain in more detail in the Pedagogy Section.
References
- Banks, A. J., (2006). Race, rhetoric, and technology: Searching for higher ground. Earlbaum.
- Rumsey, S. K. (2009). Heritage literacy: Adoption, adaptation, and alienation of multimodal literacy tools. College Composition and Communication, 60(3), 573-586. https://library.ncte.org/journals/CCC/issues/v60-3/6971
- Palmeri, J. (2012). Remixing composition: A history of multimodal writing pedagogy. Southern Illinois University Press.
- Smith, A. (2015, April 1). U.S. Smartphone use in 2015. Pew Research Center. http://www.pewinternet.org/2015/04/01/us-Smartphone-use-in-2015/
- Lutkewitte, C. (Ed.) (2014). Multimodal composition: A critical sourcebook. Bedford/St. Martins.
- Selber, S. A. (2004). Multiliteracies for a digital age. Southern Illinois University Press.
- Anderson, D. (2008). The low bridge to high benefits: Entry-level multimedia, literacies, and motivation. Computers and Composition, 25, 40-60. https://doi.org/10.1016/j.compcom.2007.09.006