Included below is a description of the IRB-approved study [IRB-300001030] I ran at the University of Alabama at Birmingham (UAB) during the Spring 2018 semester and demographic information about the study’s participants. Visit the Introduction for some background information about the study’s rationale. Visit the Access and Familiarity Section for information about the study participants' previous levels of access and familiarity with some common digital composition and research technologies. To see a detailed summary of how the study helped shape how I teach multimodal assignments in a second-semester first-year composition course, see the Pedagogy Section.
2.1 Methodology
In the Introduction, I claimed I wanted to develop a second study that examined multimodal composition habits because I wanted to know more about the students I work with at UAB. I also claimed I wanted to make sure students could successfully navigate the multipart, semester-long project I had developed for my second-semester first-year composition courses (English 102). Both of those requirements for the study were built into the data collection tool I describe below.
The data collection instrument I used during the study was a paper-based survey. As exemplified by studies published by Smith (2015)1, Shepherd (2018)2 and Green (2019)3, as well as studies used by authors like DeVoss, Eidman-Aadahl, and Hicks (2010)4, using a survey is a typical data collection method when studying how students use digital technologies. In addition, I used a paper-based survey to make sure participating in the study was voluntary and, because no directly identifiable information was added to the survey, the data I collected would remain anonymous.
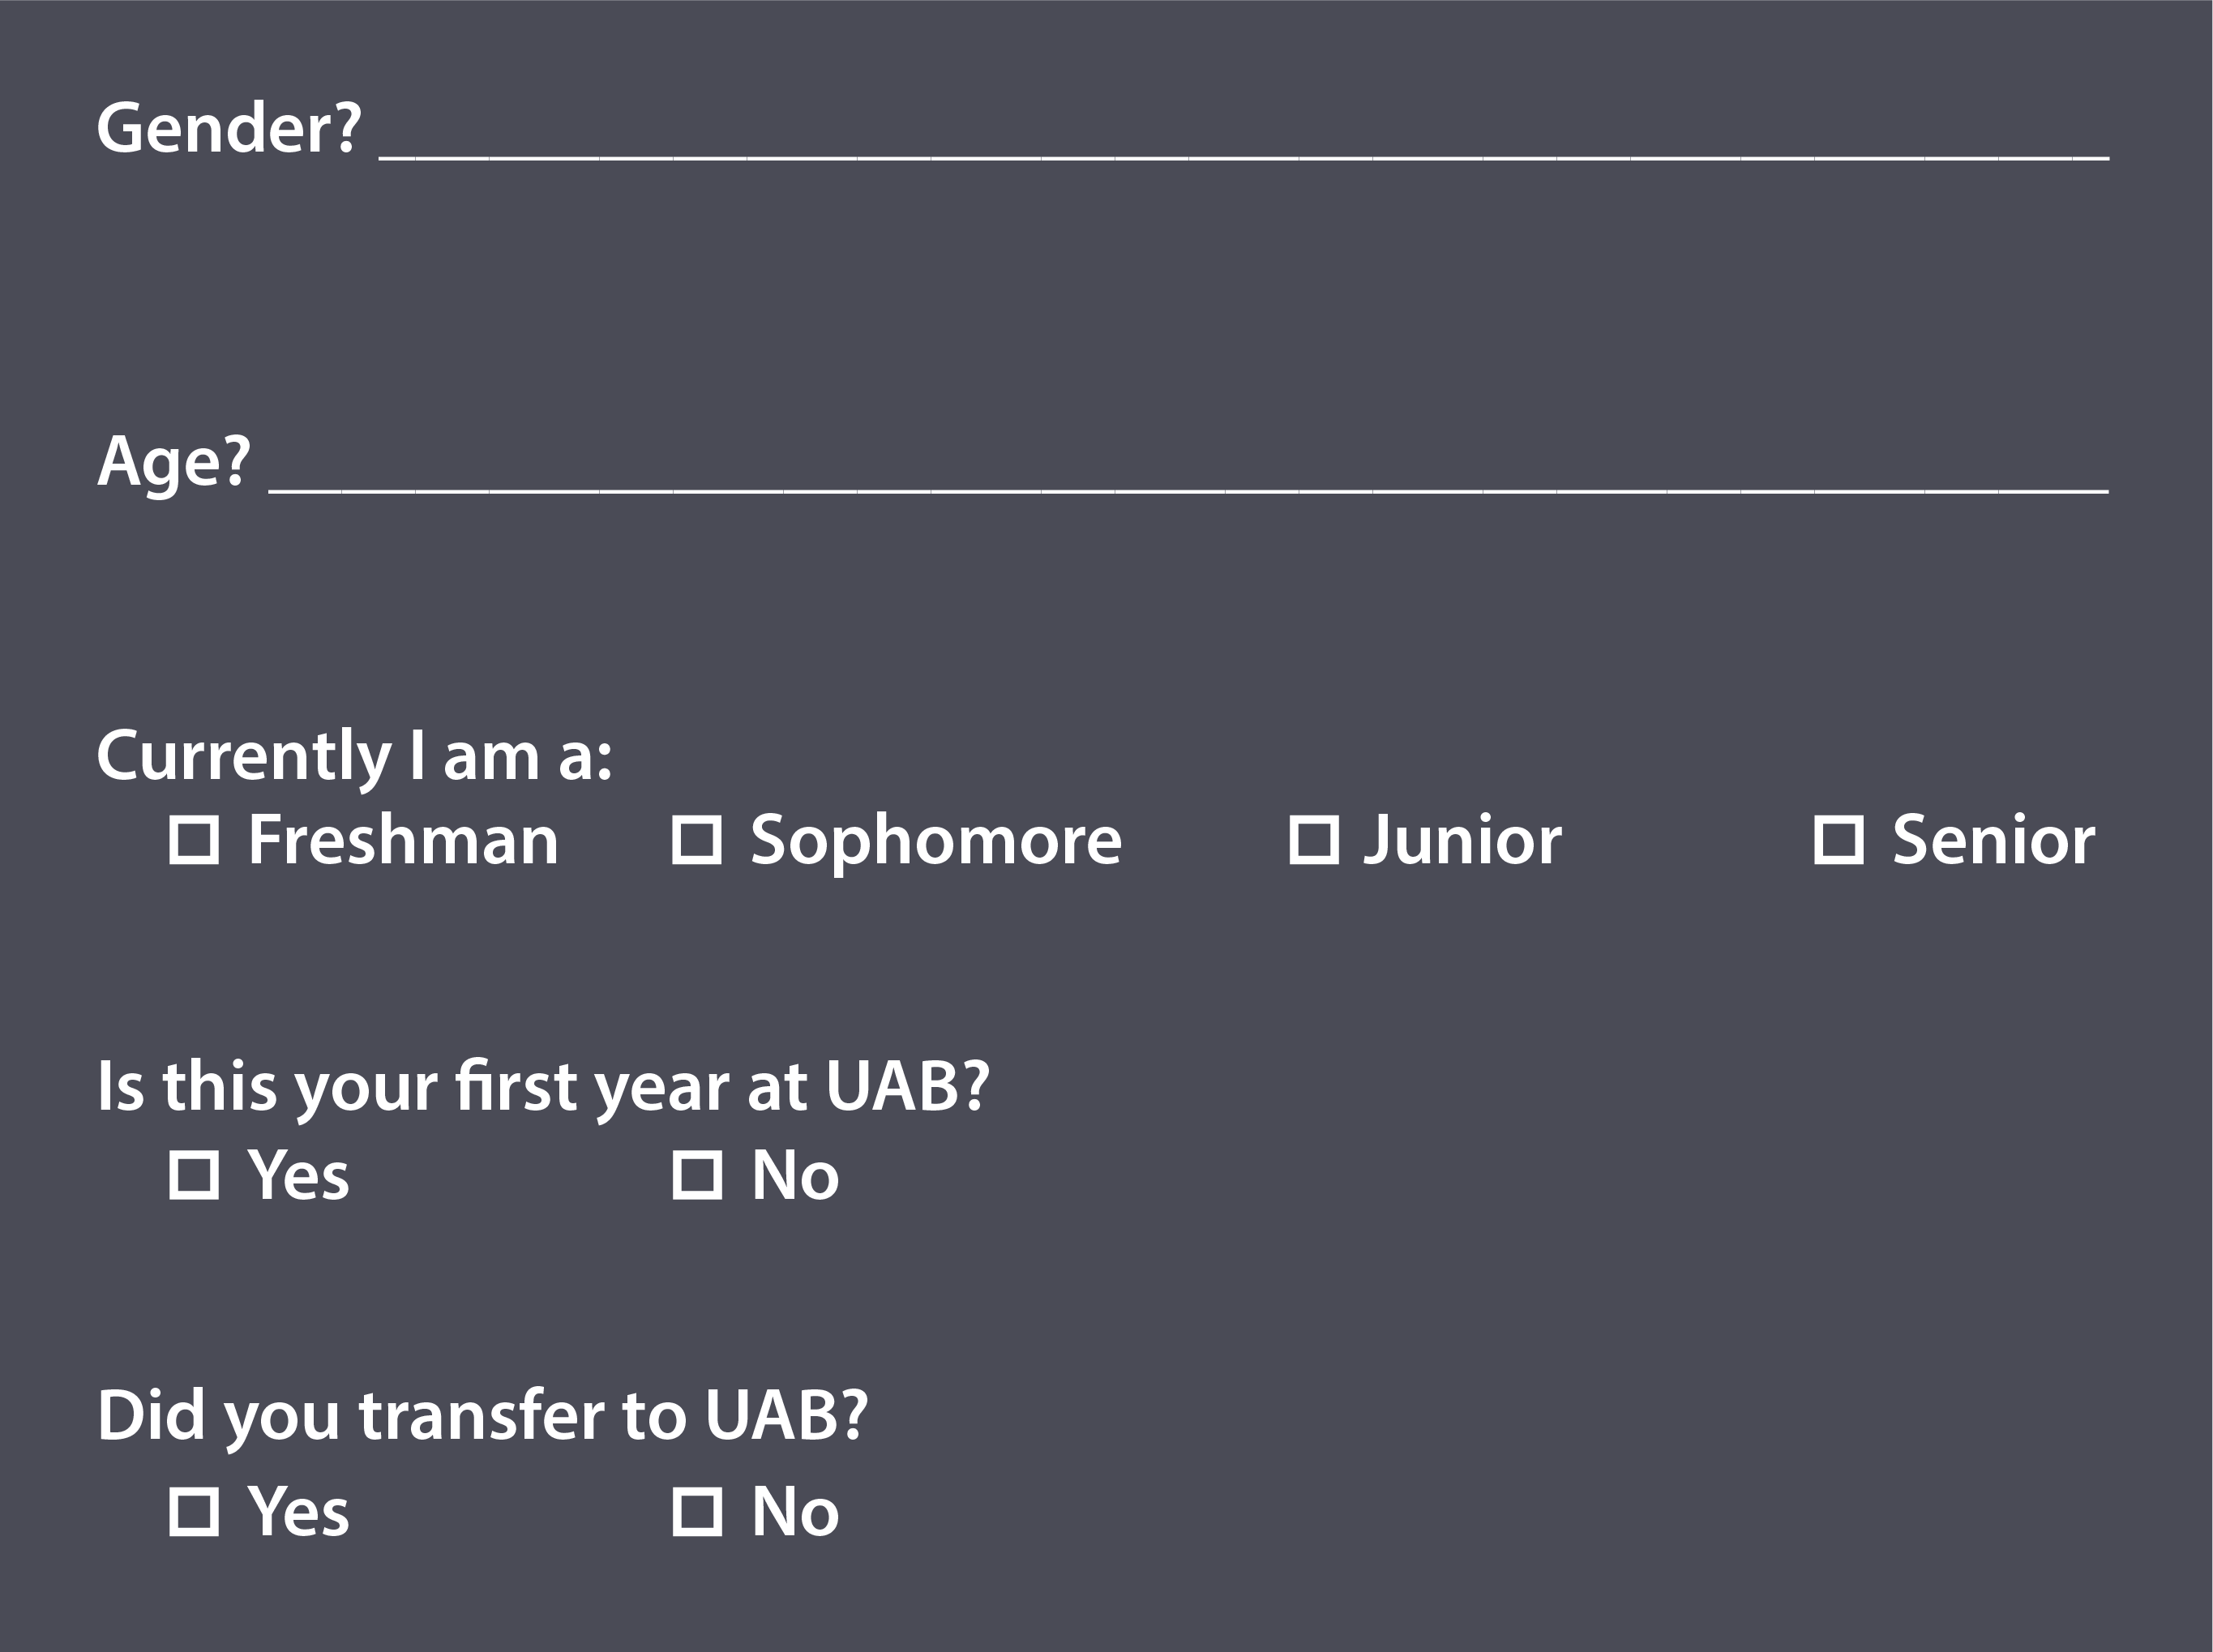
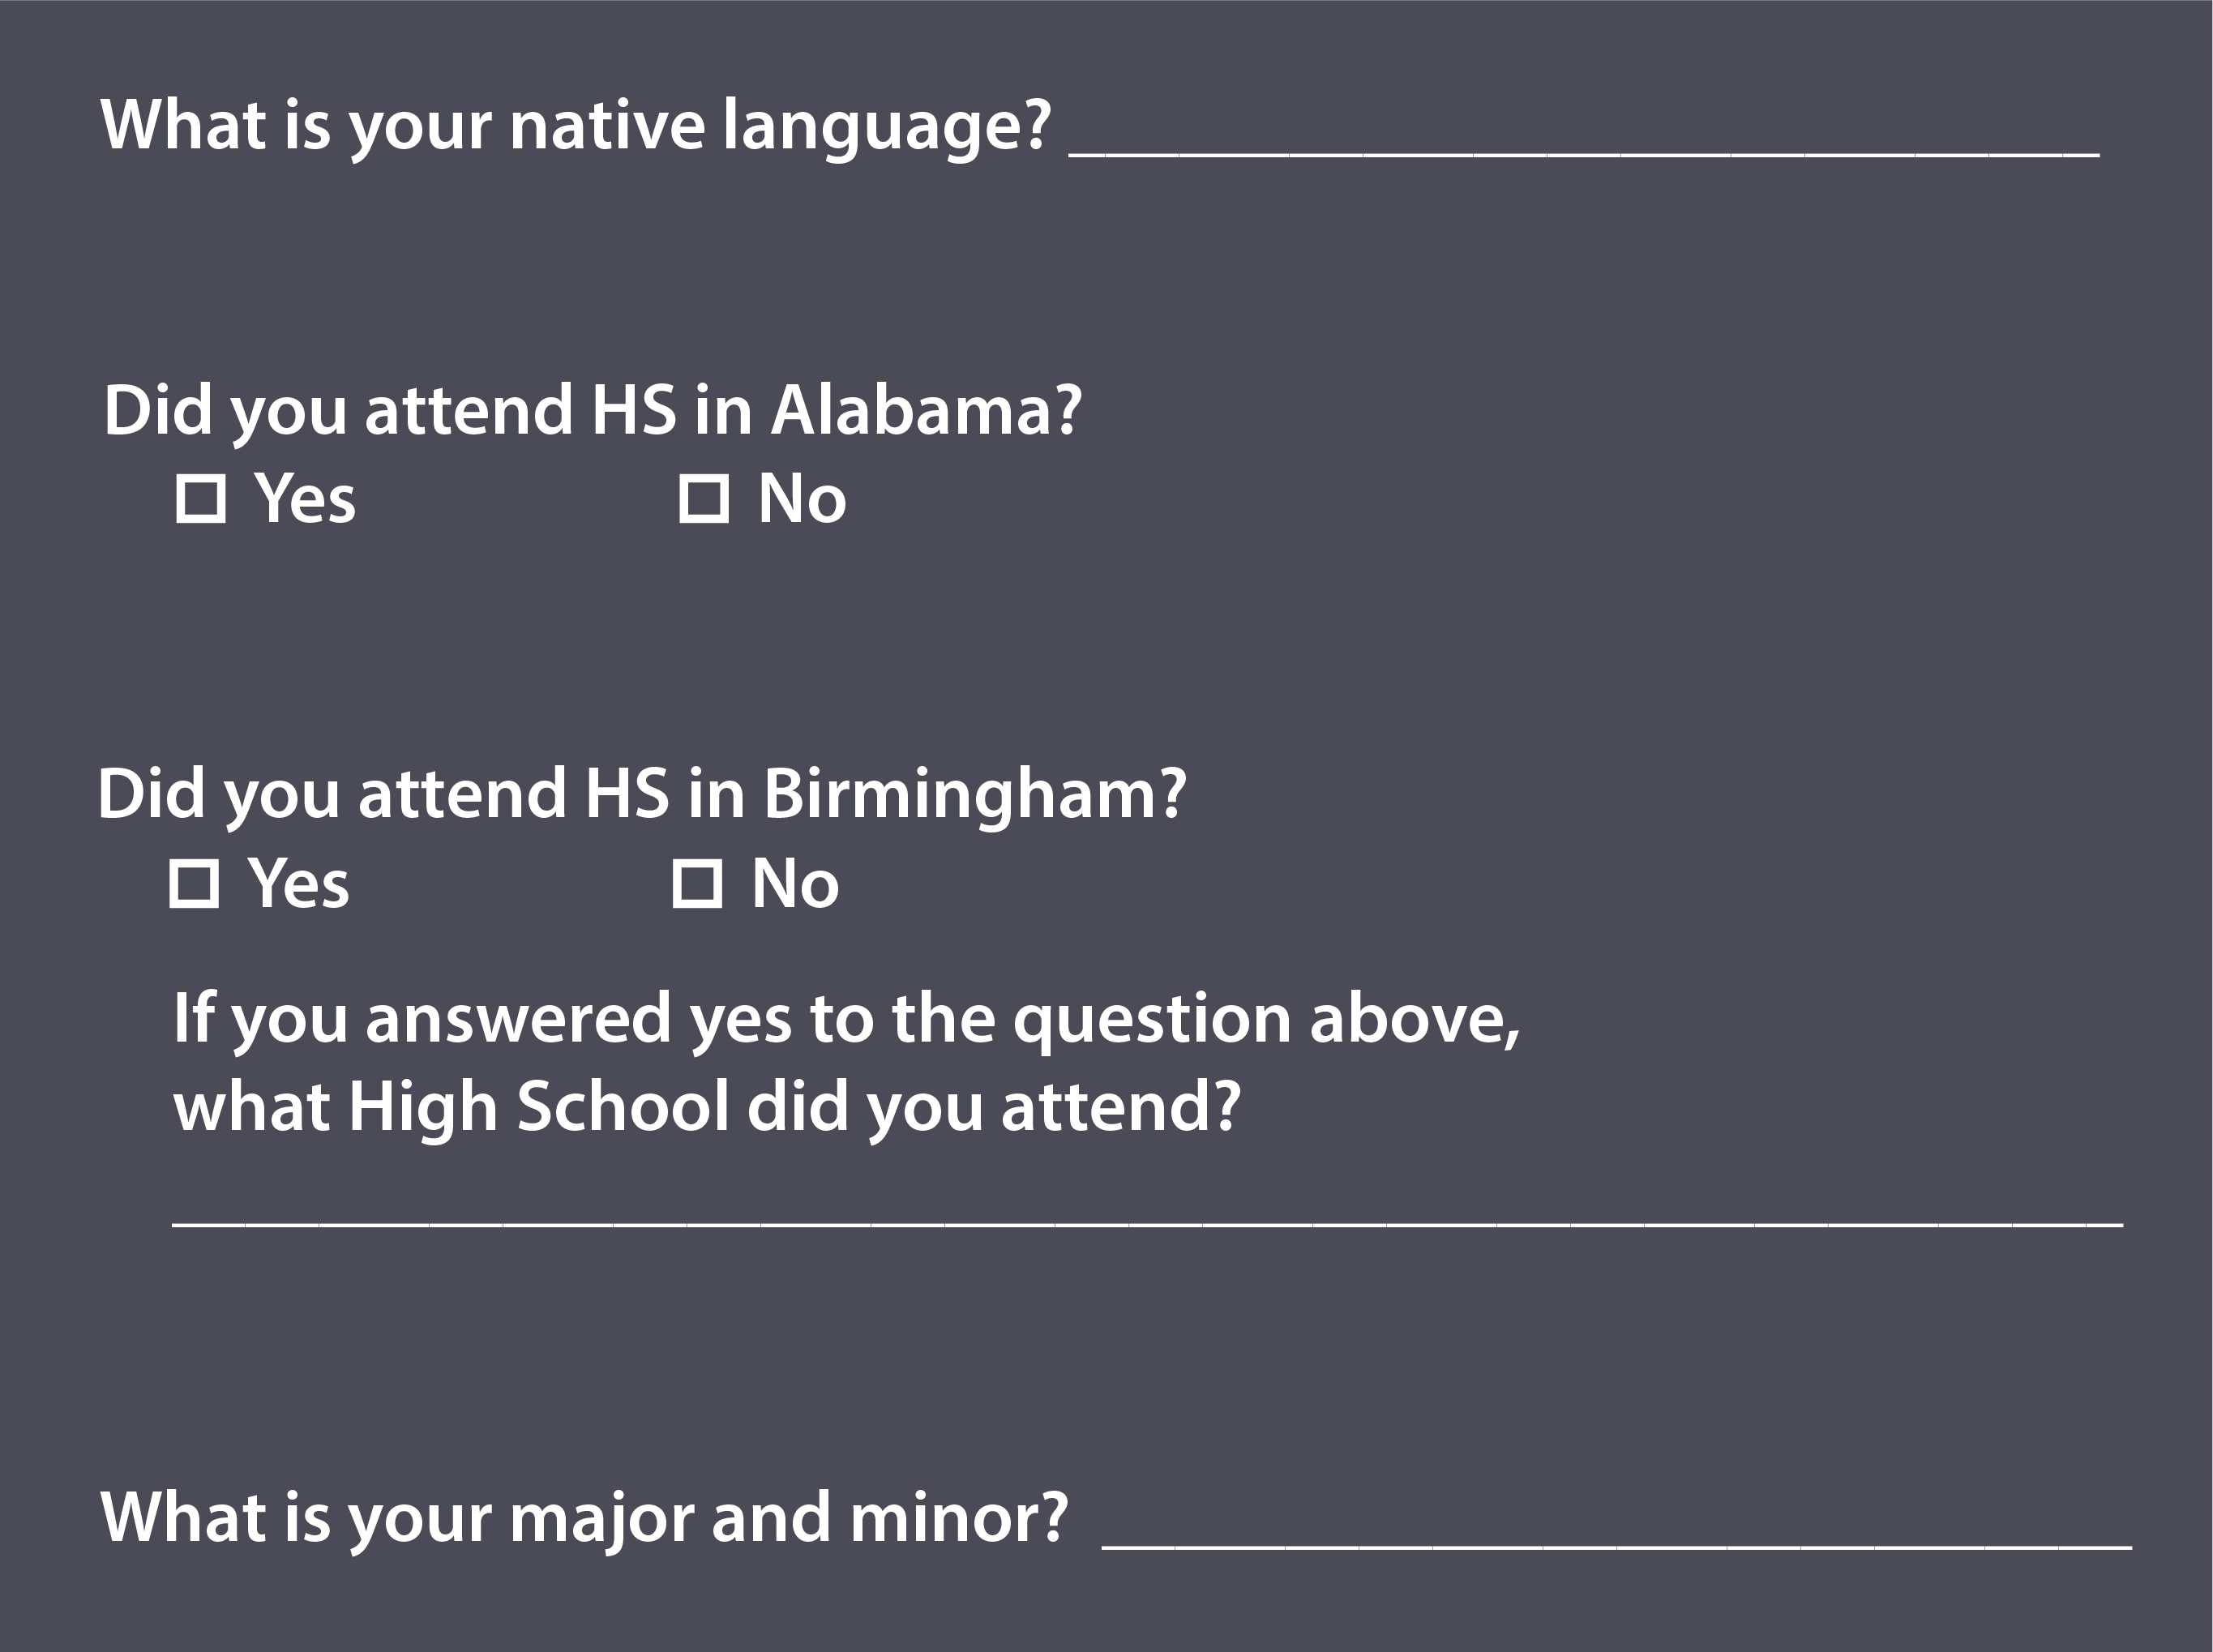
The survey itself included 31 questions: 19 yes or no questions; four open-ended questions; three Likert Scale style rating questions; and five multiple-choice questions. Nine of the survey questions also provided participants with an opportunity to clarify their answers with five additional yes or no questions and five additional open-ended questions. Because of the amount of data I collected, I have not included responses to every question from the full survey. Instead, Figures 2.1 and 2.2 include the questions I discuss in this section.
Once I had finished collecting the surveys, the responses I got from the study participants were coded and entered into an SPSS database for analysis. I also double-checked my data entry to make sure the database was an accurate reflection of the answers the study participants provided.
2.2 Participants
To recruit participants into the study and to ensure students did not fill out multiple surveys, I visited 33 out of a possible 52 sections (63%) of English 102 held on the campus of UAB during the Spring 2018 semester. I only visited each classroom once. I did not distribute any surveys to students in the classes I taught. No incentives were offered to the students who did participate and participation in the study was completely voluntary.
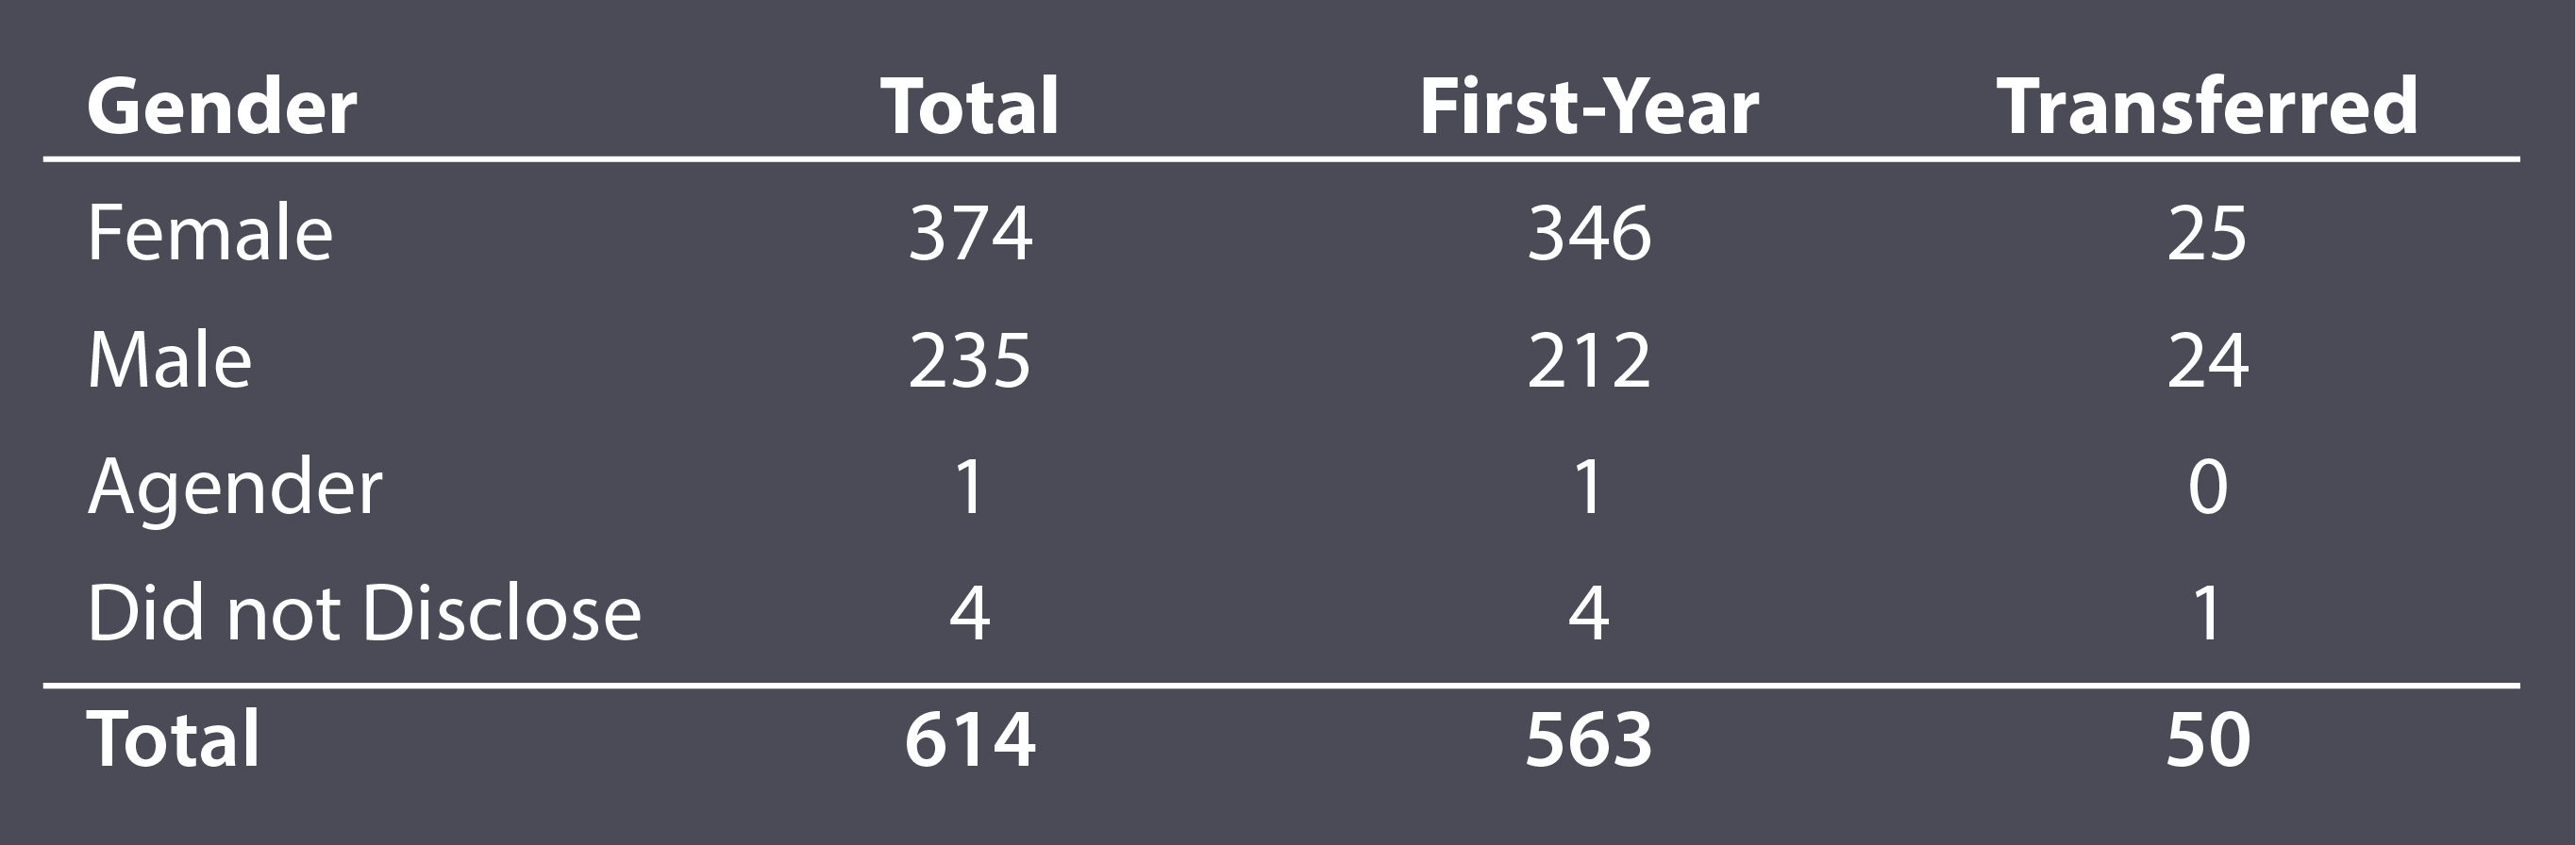
As shown in Figure 2.3, I collected surveys from 614 out of a possible 1,235 students enrolled in the 52 sections of English 102 held on UAB’s campus during the Spring 2018 semester. In other words, I was able to achieve a 49.7% response rate.
As Figure 2.3 also illustrates, 374 participants self-identified as female. 235 participants self-identified as male. One participant self-identified as agender. Four participants did not disclose their gender. Out of the 614 students who agreed to participate in the study, 563 claimed to be first-year students at UAB and 50 claimed to be transfer students.
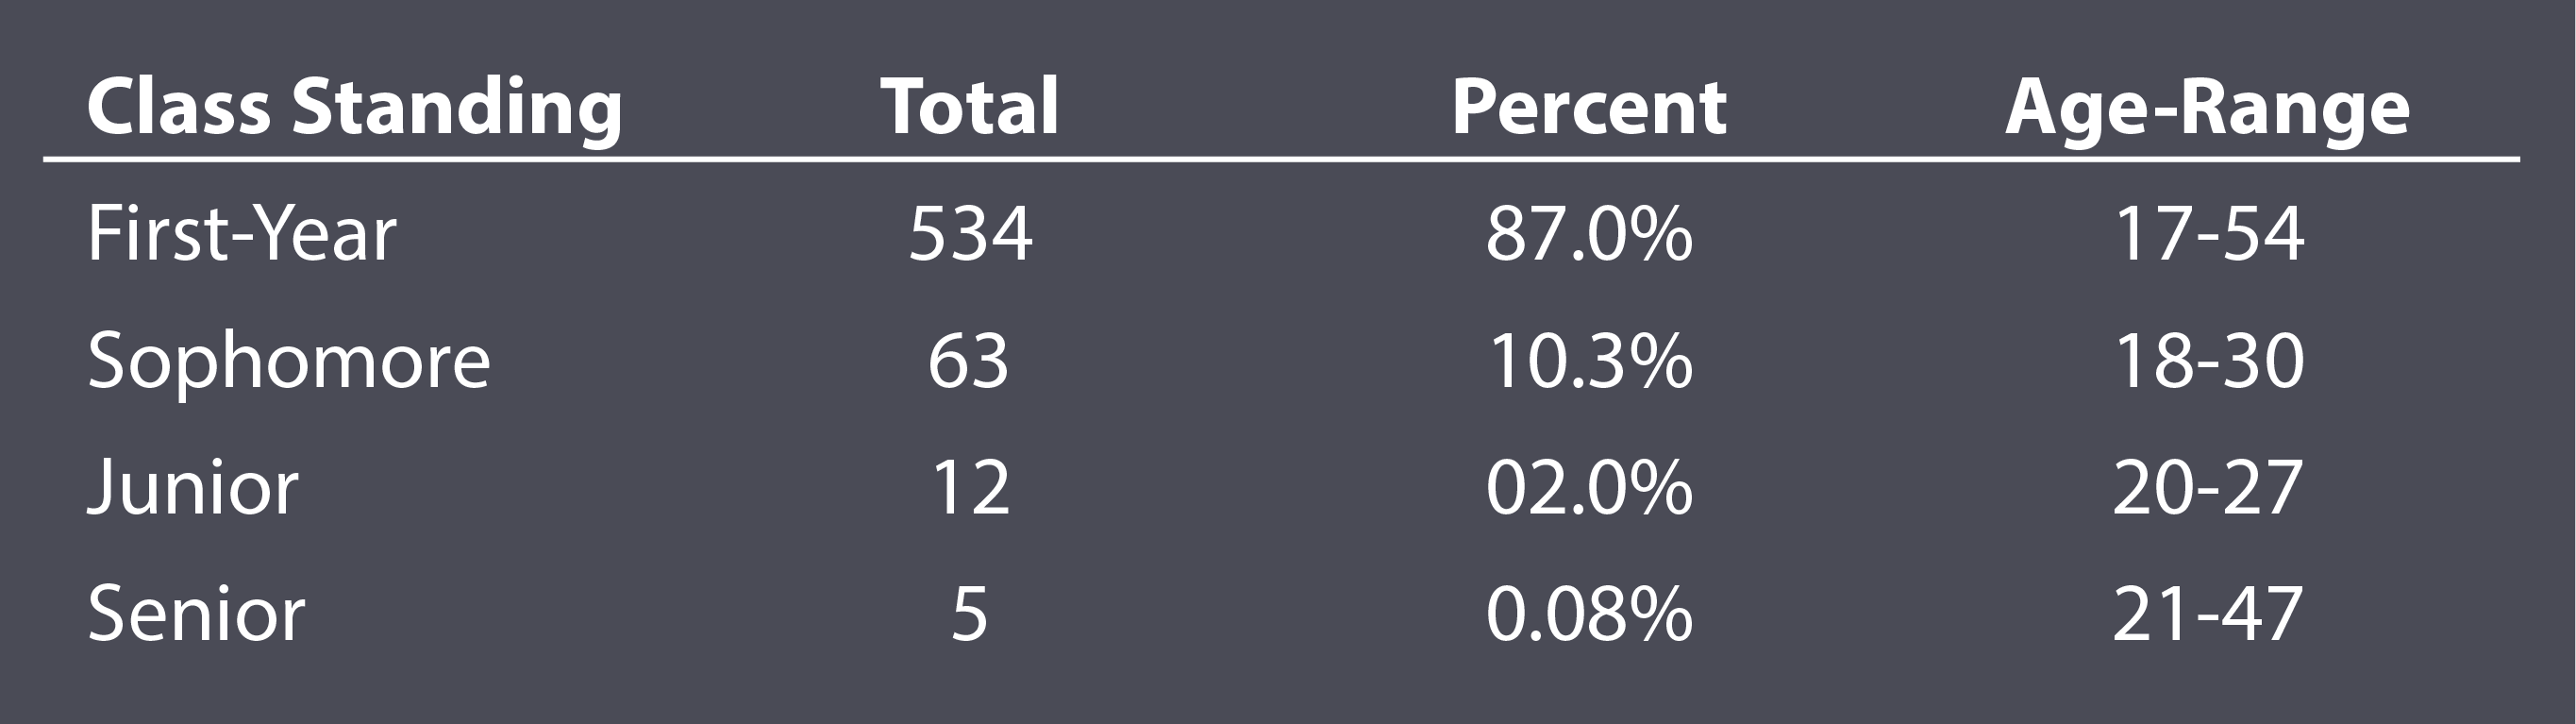
The age range of the participants, as illustrated in Figure 2.4, was between 17 and 54. Although most of the participants claimed to be in their first year of college (534), the study did include participants who identified as sophomores (63), juniors (12), and seniors (6). Both the age range and range in class standing of the participants was significant.
As I stated in the Introduction, I wanted to include students in the study who had completed at least one semester of college classes. Based on the demographics presented in Figures 2.3 and 2.4, and the fact that most students need to pass our first-semester course or fulfill that requirement with transfer credits before enrolling in English 102, I achieved my goal.
In addition, the range in demographics listed above is a common occurrence. Although English 102 is a graduation requirement, many students at UAB wait as long as they can before enrolling in English 102, and UAB has a long history of accepting students who did not go to college directly after high school. As such, I have decided to include responses from all of the students who agreed to participate in my study in the results that I present in this webtext.
2.3 Clarifications
Three additional pieces of demographic information I collected from the participants were their major, their minor, and the name of the high school they attended. This was done in an attempt to make sure I received data from a diverse pool of participants. In total, the participants self-identified 56 different majors and 50 different minors. The study also included participants from 58 different high schools; graduates from in-state, out-of-state, and private high schools were all represented.
Graduates from almost all of the local high schools were also included in the study. I was able to collect data from graduates of all seven high schools included in the Birmingham City School District, 13 out of the 14 Jefferson County School District high schools, and 9 out of the 11 high schools generally considered to be in the Birmingham Metro Area.
Meaning, my study included participants from 29 out of the 32 public high schools that are generally considered to be in the Birmingham Metro Area. That was significant because UAB has historically recruited a large number of commuter students. In fact, according to UAB’s office of Institutional Effectiveness and Analysis, 46% of all students enrolled at UAB during the Fall 2019 semester were from the Birmingham Metro Area5.
2.4 Next Steps
As I mentioned at the end of the Introduction, I have split the major results of my study into two separate pages. I have included results and a discussion related to Access and Familiarity in one page and have included results and a discussion related to Pedagogy in a separate page. Each of those pages can be explored in any order because they both offer their own self-contained arguments.
References
- Smith, A. (2015, April 1). U.S. Smartphone use in 2015. Pew Research Center. http://www.pewinternet.org/2015/04/01/us-smartphone-use-in-2015/
- Shepherd, R. P. (2018). Digital writing, multimodality, and learning transfer: Crafting connections between composition and online composing. Computers and Composition 48, 103-114. https://doi.org/10.1016/j.compcom.2018.03.001
- Green, M. (2019). Smartphones, distraction narratives, and flexible pedagogies: Students’ mobile technology practices in networked writing classrooms. Computers and Composition 52, 91-106. https://doi.org/10.1016/j.compcom.2019.01.009
- DeVoss, D. N., Eidman-Aadahl, E., & Hicks, T. (2010). Because digital writing matters. Jossey-Bass.
- UAB Office of Institutional Effectiveness and Analysis (n.d.). UAB Enrollment by student source: Fall 2019. https://www.uab.edu/institutionaleffectiveness/images/documents/enrollment-by-source/2019-Fall-Enrollment-by-Source.pdf