Survey

Background and Rationale
The survey discussed here investigated OWI and the experiences of college-level writing instructors during the pandemic in academic years 2020-2021 and 2021-2022. Development of this survey and deployment to participants across an entire state university system was inspired by findings from a small, local program assessment completed in my writing studies department during the summer of 2020. That program assessment explored the initial challenges instructors faced in moving their writing courses online and sought information about the kinds of professional training and support they desired as they prepared for teaching in fall 2021. Those early pandemic findings, published in Composition Studies in spring 2021, found that while instructors improvised innovative approaches to their online teaching in the first months of the pandemic, they also struggled with issues of pedagogy, technology, workload, and personal and professional well-being (Sheppard, 2021). In creating the broader survey of more educators from a diverse set of campuses two years into the pandemic that is discussed here, I was interested in how the preparation for and practices of OWI may have changed over time, as well as what researchers, program administrators, and graduate faculty could learn from these experiences that would help to strengthen future online teaching.
Due to space constraints and the focus of this special issue on digital writing pedagogies, the results reported here are a subset of a larger 36 question survey that gathered both quantitative and qualitative data. The full set of survey questions is available in the appendix, but of relevance to the focus of this article are the following research questions:
- What pedagogical and technological training and professional development did online writing instructors engage with and how did it inform classroom practices?
- What can scholars learn from the widespread online teaching experiences during the pandemic that can inform future academic training and ongoing professional development needs related to online writing pedagogy, classroom instruction, and instructional technology use?
Participants
 Participants for this survey were recruited from English departments and writing programs in a large public state university system in the western United States. Given the similarities in the system’s statewide required writing courses, the system-wide mandate for teaching entirely online during the 2020-2021 academic year, and the roughly equivalent class sizes and teaching workloads for instructors, this subject population offered a large, comparable pool of respondents. At the same time, campuses in this system are geographically dispersed in rural and urban communities. The system has a combined student body of almost 500,000 that is racially, ethnically, socioeconomically, and linguistically diverse, offering a varied cross-section of instructor experiences. Additionally, each of these campuses took individual approaches in 2021-2022 with some returning to in-person instruction, others staying mostly online, and still others increasing prior numbers of hybrid course offerings, providing another important area of comparison.
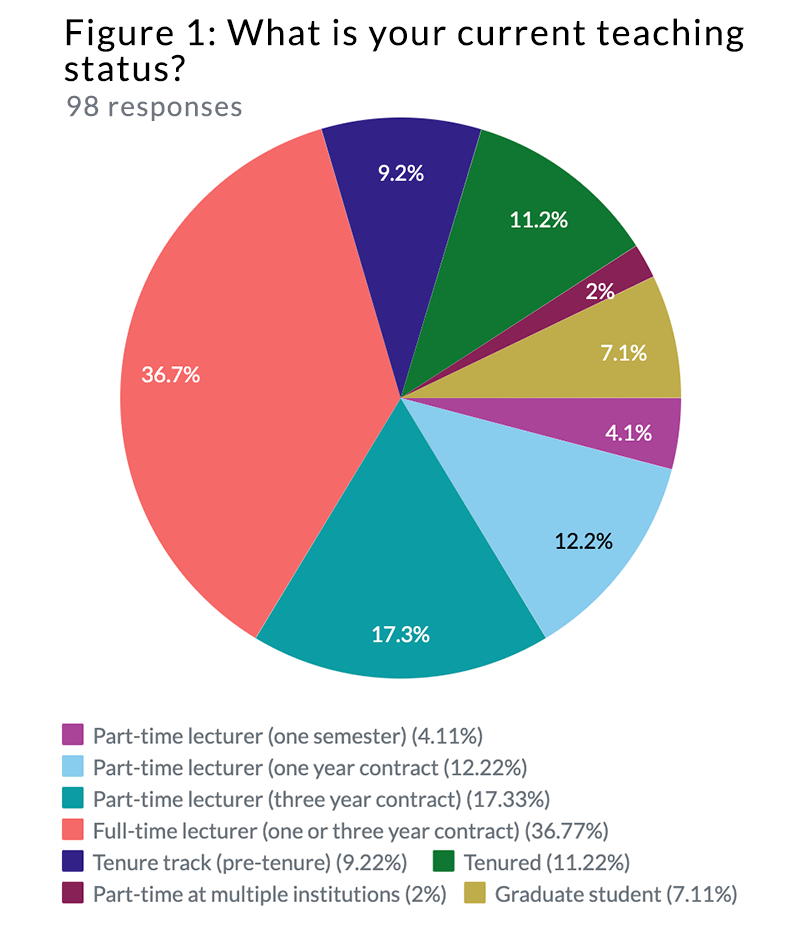
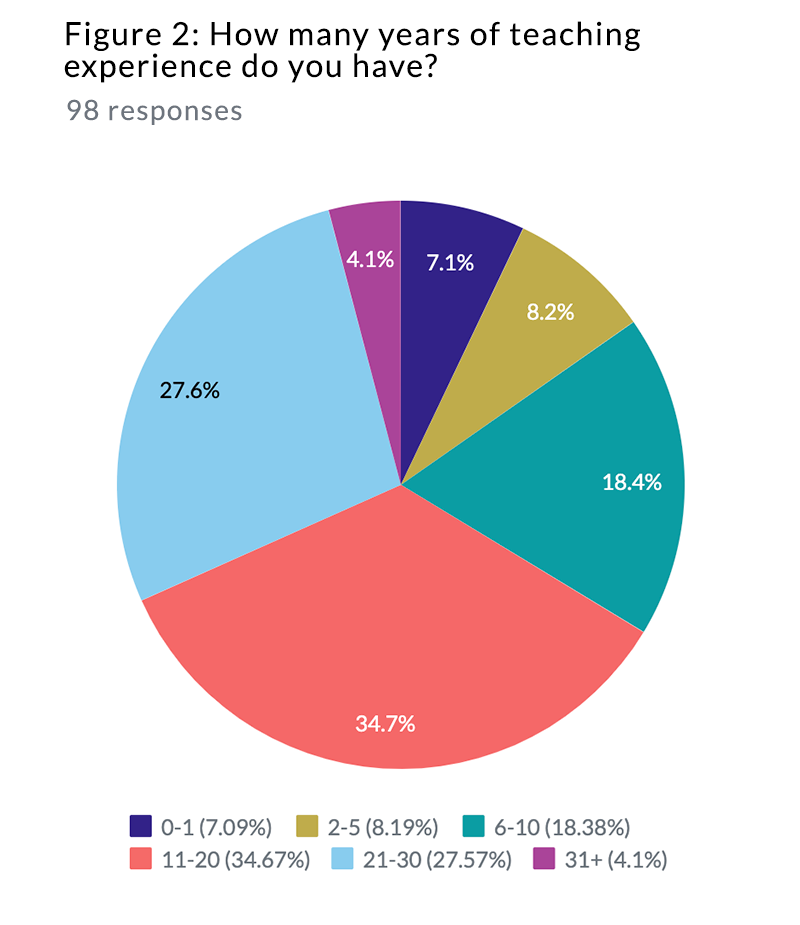 Participants in this IRB-approved survey (IRB protocol: HS-2022-0029) were asked to complete a Google Form consisting of 26 closed- and 10 open-ended questions that took approximately 15 minutes to complete. A total of 98 survey responses were received from participants at 19 of the 23 campuses in the university system. The survey was open to all tenured/tenure track faculty, lecturers, and graduate student teaching assistants who taught writing in any modality (online, hybrid, and/or in-person) in 2020-2021 and/or 2021-2022. As illustrated in figure 1, the survey captured responses from a roughly even representation of these teaching status categories. Additionally (figure 2), respondents represented a continuum of teaching experience, inclusive of those in their first year of teaching (7%) and those who reported teaching 31 years or longer (4%) with over a third of participants (34.7%) having taught between 11 and 20 years. Combined with the diversity of participant’s degree field (including PhDs in rhetoric and composition, MAs in literature, MFAs in creative writing, a JD in law, and an MA in religion), the survey provides an important snapshot of who teaches writing in this university system and what backgrounds and experiences they brought to the pandemic OWI transition.
Finally, while it is not explored in depth here given the focus of this article, it is critical to acknowledge the heavy workload and feelings of professional strain that existed for many of the survey participants even before COVID-19. More than 55% of respondents teach upwards of 76 students (with 33% teaching 100 or more) and 54% have teaching loads of 4-6 courses per semester. Given the guidance in the CCCC position statement on the postsecondary teaching of writing (2015) that “[n]o more than 20 students should be permitted in any writing class” and that “[n]o English faculty members should teach more than 60 writing students a term” (CCCC, Task Force), it is hardly surprising that, with the added workload of the OWI transition, responses to qualitative survey questions are filled with comments about burnout, frustration, and feeling undervalued.
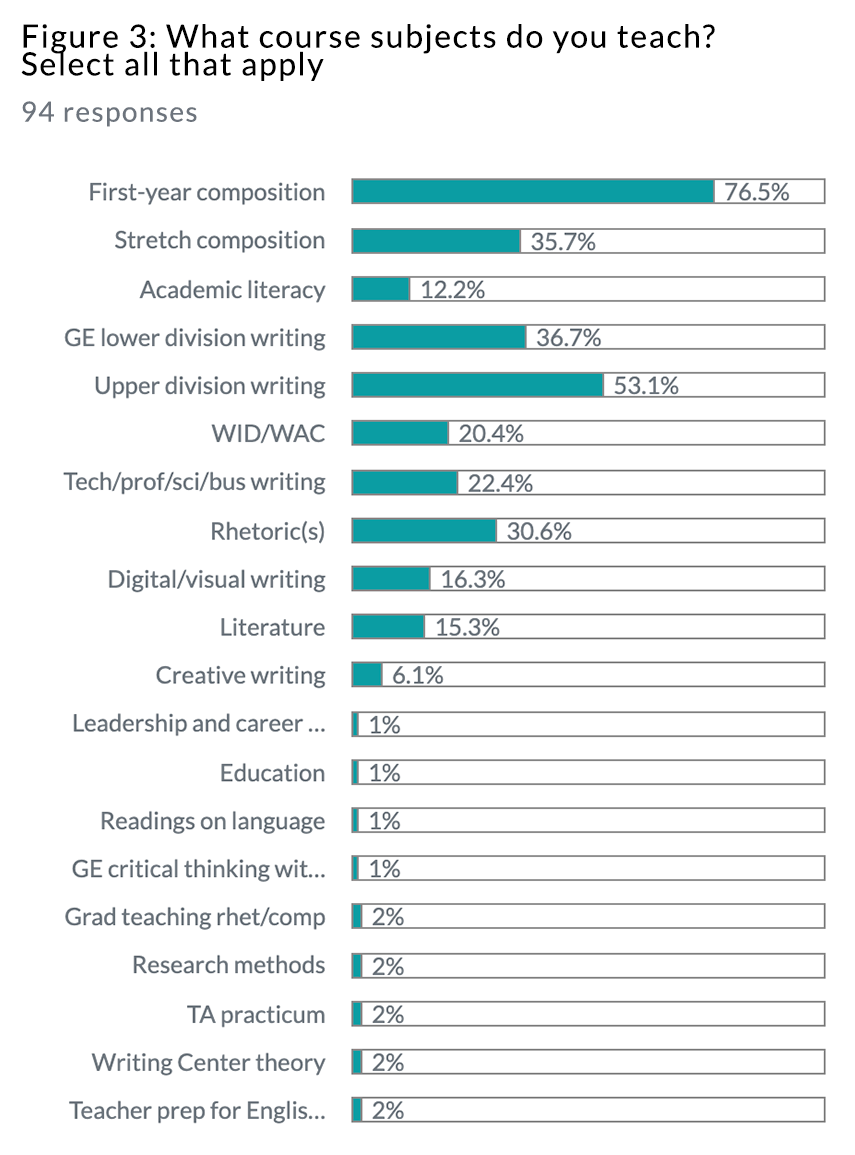 For the purposes of this study’s recruitment of writing instructor participants, the term “writing” was defined inclusively to refer to all iterations and levels of composition, technical, professional, scientific, and business writing, digital and multimodal writing, academic literacy, and writing for majors/disciplines/professions. As seen in figure 3, this diversity is represented among survey participants. Although most respondents reported teaching first-year composition (76.5%) and/or upper division writing courses (53.1%), their experience also included many other writing, rhetoric, literacy, and English studies courses. This is significant because not only were instructors developing pedagogies for teaching writing in new modalities, they were also designing for diverse content and student populations.
Methods
The survey used a mixed methods approach to collect basic demographic and quantitative information, as well as qualitative data on participants’ professional training and teaching experiences. Creswell and Clark (2018) argued that mixed methods are appropriate for research projects “in which one data source may be insufficient” with findings needing to be explained, expanded, compared, or contrasted (p. 8). Similarly, Greene (2007) suggested that mixed methods provide researchers with “multiple ways of seeing and hearing, multiple ways of making sense of the social world, and multiple standpoints on what is important” (p. 20).
Using a mixed methods approach for this project was ideal for examining the complex experience of educators’ online teaching during the pandemic. Quantitative data related to shifts in workload, for example, can only provide a numeric accounting of changes in hours worked, but cannot account for what teaching or professional development activities were undertaken as part of workload shifts and why. A qualitative component can address the latter types of questions in detail, providing a more complete picture of pandemic teaching experiences. As Creswell and Clark explained, “quantitative results can net general descriptions of the relationships among variables,” but qualitative data “can help build [an] understanding of what it means” (p. 9).
In beginning analysis, I examined the pie charts or bar graphs that Google Forms automatically generated for participants’ responses to simple yes/no and multiple-choice questions. These visualizations allowed me to identify and compare issues such as prior online teaching experience, sources of professional development, and uses of instructional technology. They offered limited but important context for the accompanying open-ended inquiries.
In analyzing responses to qualitative questions, I started by writing short comments with initial observations to familiarize myself with the data. As Lester et. al., (2020) suggested, “these initial understandings can often inform a researcher’s later, more detailed analysis. Thus, it is important to be aware of and chronicle in detail these early reactions to the data” (p. 99).
Next, I coded responses to identify concepts, topics, and experiences. In the first pass through the data, I assigned short, primarily descriptive codes to all responses. Second and third passes through the data sought to refine codes to ensure they were reflective of respondents’ comments. Finally, I examined the codes to identify broad but repeated themes in the data. According to Braun and Clarke (2012), recursive thematic analysis will produce themes that each have a single focus, build on one another but do not overlap, and connect to the research question (p. 66). I completed the analysis process by using these themes to report on survey participants’ teaching modality preferences, professional preparation, and experiences with instructional technology in their OWI.
In the next three sections of this webtext, I discuss survey findings related to three themes: online instructional experiences, professional preparation for OWI, and uses of instructional and composing technologies in online writing courses. Readers can visit these pages in a linear order by clicking “Next” at the bottom of each page or in any order by using the links in the navigation menu.