Classroom Experience: Spring 2014
Early in this unit, I assigned students to spend an hour at home examining some portion of the data and to report on the trends they noticed. I tried to emphasize the exploratory nature of this activity. They did not have to find an answer, just tell me what it was like to read through the data. Their reactions, quoted here from reflective questionnaires submitted with the final draft of their project, were typical:
- Jenna:
I was overwhelmed because there were lots of drafts and I was not sure how to compare them or how many to compare.
- Maggie:
I right away thought it was an extreme amount of data and that it would be very complicated to pick a slice.
- Liz:
I'm not going to lie. I am very studious, but when I first saw how many drafts there were and how long each one was, my immediate reaction was ‘holy crap, how am I going to analyze all of this?’
Essentially, most students felt exactly like real researchers do when they make their first pass through a robust data set: overwhelmed and confused. I expected these reactions and reminded them about Carol Berkenkotter's (1983) Decisions and Revisions: the Planning Strategies of a Publishing Writer
and Sondra Perl's (1979) The Composing Processes of Unskilled College Writers,
which we had read. Both scholars had gathered a lot of data, but their essays did not use all of it. Berkenkotter emphasizes Murray's planning strategies, and Perl spends the most time on one student out of the five who participated in her study. Other data may have been referenced by both researchers, but they were less important for the essay's focus. I told students researchers must decide what patterns most interest them or are most relevant to their research question. We called this taking a slice from the data.
Once students knew they did not have to include something from every artifact in their five-page essays, they chose particular slices to study carefully. Providing data offered a major advantage in this area. Because I knew the data's boundaries, I was more able to help them develop viable research avenues. That does not mean I analyzed the materials in advance. I consciously avoided doing so to keep from prejudicing myself against what the students might discover. I just knew what kind of questions the data set would allow researchers to ask and what results seem the most probable. Once they drafted a good question, we could work together to decide where to dive into the data.
The most popular questions centered on either planning or revision processes. I suggested students interested in the planning aspect begin their research by listening to a talk-aloud protocol of my brainstorming.
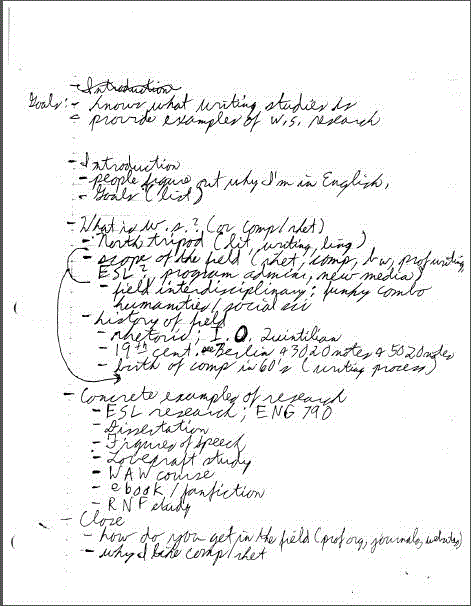
They could compare this data with a scanned copy of my brainstorming notes or a screencast where I typed the first draft.

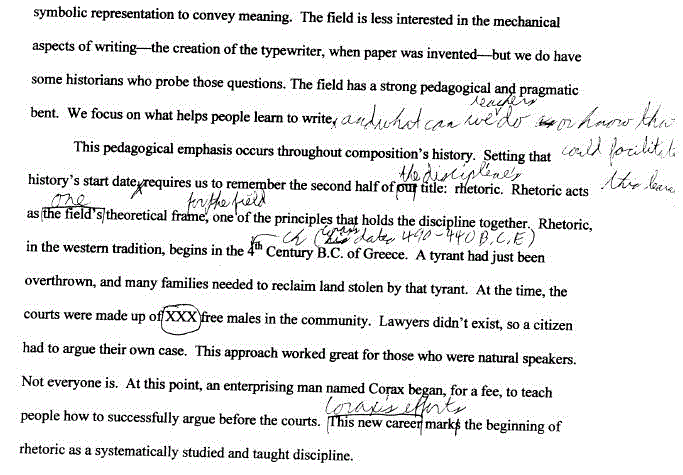
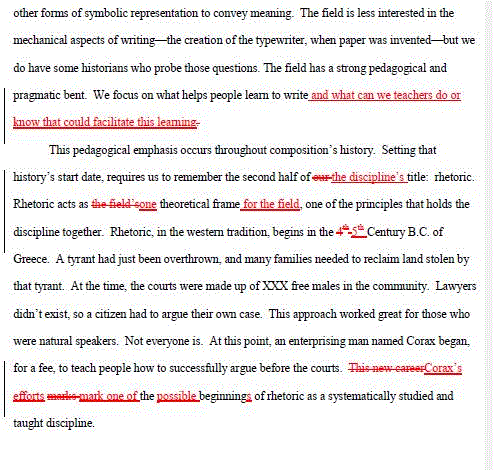
Students interested in examining revision could draw on scanned copies of my drafts. I typically revise by hand, but in order to keep students from having to decipher my scribbling, I included a copy of each draft revised with Word's track changes feature on.


I also created two videos showing my revision process, an excerpt from one appears below. It shows the same portion of text as depicted in the revisions.
Students and I conferenced to determine which drafts fit their research questions. Some focused on only the early or later stages, depending on whether they were more interested in large-scale or small-scale revisions. Others chose the odd or even numbered drafts so that they could talk about how my revision process changed over time. At least one decided to trace individual sentences as a way of determining how grammar concerns factored into my process.
Not all students chose viable questions. Because I knew the data set's boundaries, I could direct students away from these dead ends. The data set offered little material that pointed to my emotional states while writing. Since I had prepared the data the summer before, I could not remember how much of my eye rubbing and head scratching in videos was caused by annoyance and how much was just nervous tics or allergic reactions to a bad pollen season. I could also help students understand what counted as data versus what was part of the apparatus for gathering the data. One student, for example, tried to argue the talk-aloud protocol was a normal part of my process. It isn't. If students were gathering their own data, I could not make either of these leaps about the data as easily.
Having a shared data set also allowed the class to sketch out analyses together. Someone provided a claim, and we divided up the data sources in order to find evidence. We used the shared claims to discuss possible coding categories. When a student suggested tracking types of revision, I described the classic divisions of addition, deletion, substitution, and reorganization. Other students suggested different categories, such as counting the number of words changed in a particular hunk of text. Once the categories are set, the students returned to the data, looking for examples of each category. A week of classes was dedicated to in-class work, with students working along, collaborating with a classmate, or conferencing with me.