analysis i
1— ‡ —2— ‡ —3— ‡ —4— ‡ —5
The
Analysis I section visualizes data from DMAC's annual registration records (participant, year,
home institution)
and the Carnegie Foundation (institutional population, control, and classification).
Navigate this section with the numbered
buttons above, and mouse over the visuals for more information.
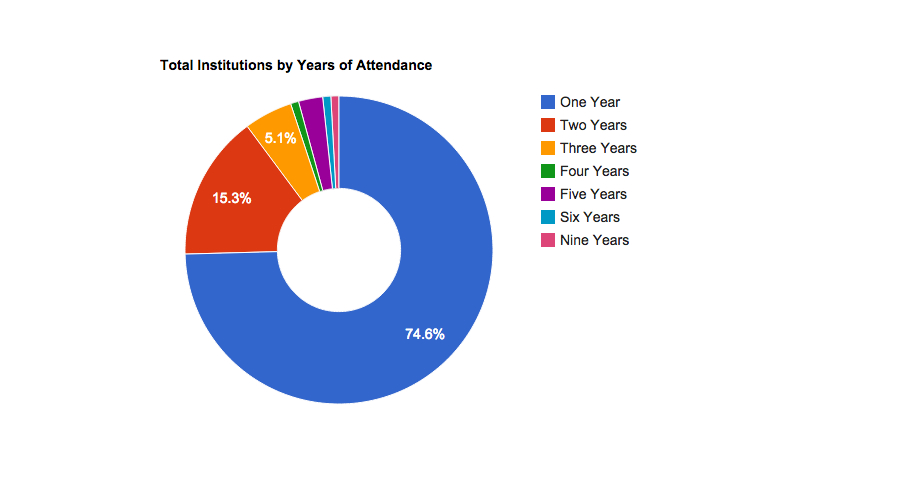
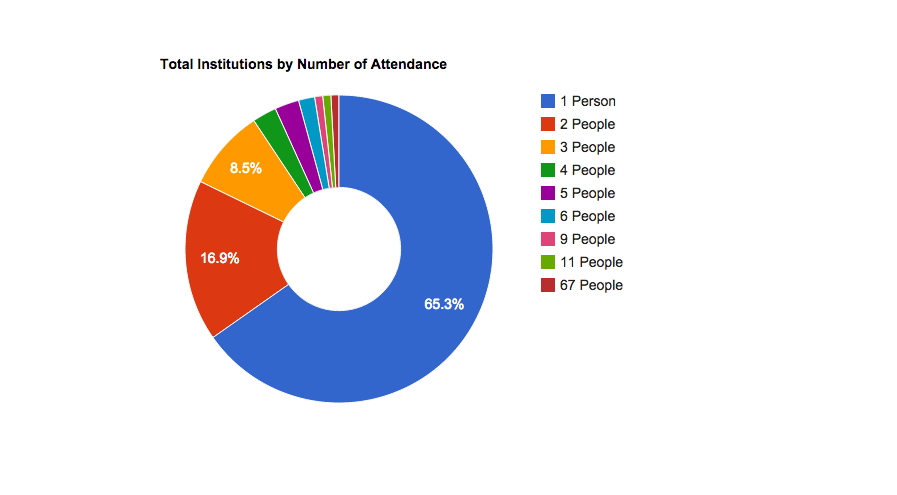
Three fourths of home institutions have sent participants to no more than one DMAC
Institute, and almost two
thirds of home institutions have sent no more than one participant. Home institutions
sending participants to two or
three DMAC Institutes and home institutions sending two or three participants account
for a large majority of the remainder in both cases.
From an institutional standpoint, DMAC relies heavily on first-time and one-time participation
just as much as (if not more than) it
relies on a tight network of familiars. The next page (
2
above) shows how these overall figures translate to the distribution
for any given DMAC Institute.
Click here to download a static image of this chart
Click here to download a static image of this chart