analysis ii
1— ‡ —2— ‡ —3— ‡ —4— ‡ —5— ‡ —6
The
Analysis II section visualizes data from a 2014 survey sent to all DMAC alumni. For a full account
of the survey questions, see the
Method
section of this article. Navigate this section with the numbered buttons above, and
mouse over the visuals for more information.
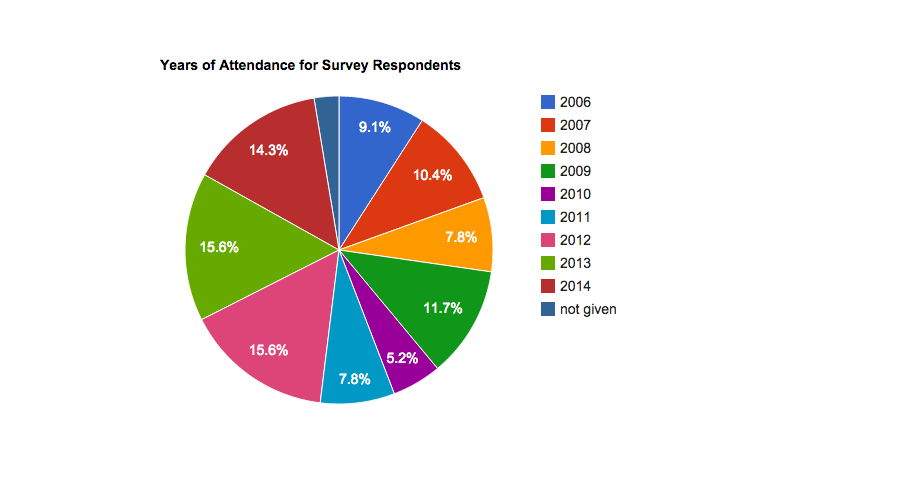
Participants from every DMAC Institute submitted responses to the survey, with an
approximately 50% greater response rate from more recent Institutes (2012-2014).
Outdated email addresses (the means of survey distribution), changing career priorities,
and the
freshness
of memory may partially explain the drop in responses
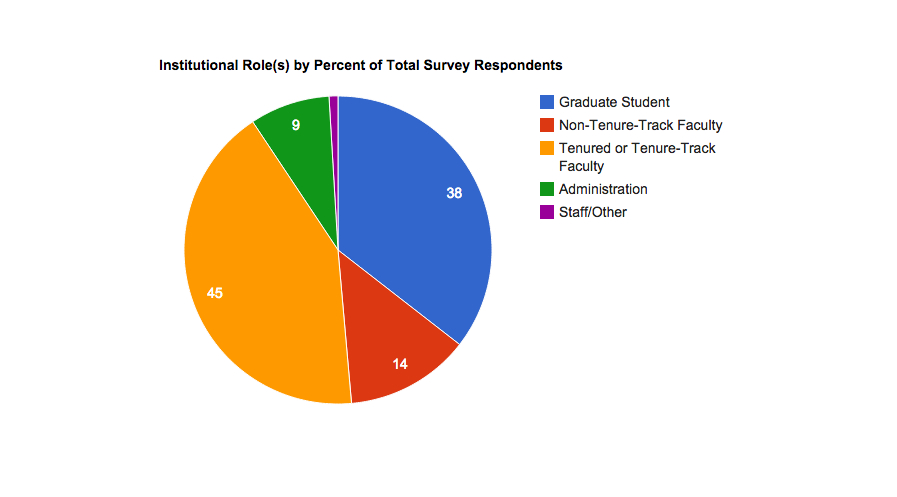
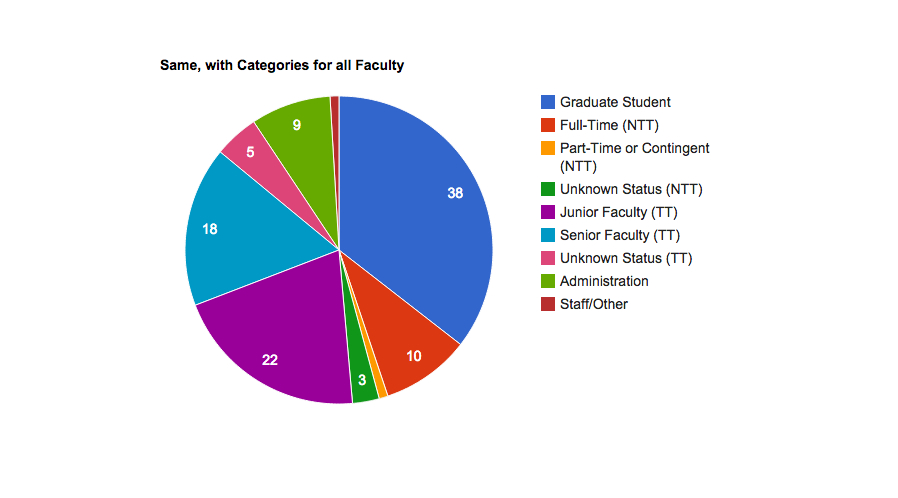
from DMAC alumni prior to the 2012 Institute. Most responses come from what I'd call
the
middle rung
of academic labor: graduate students and tenured or tenure-track faculty (38% and
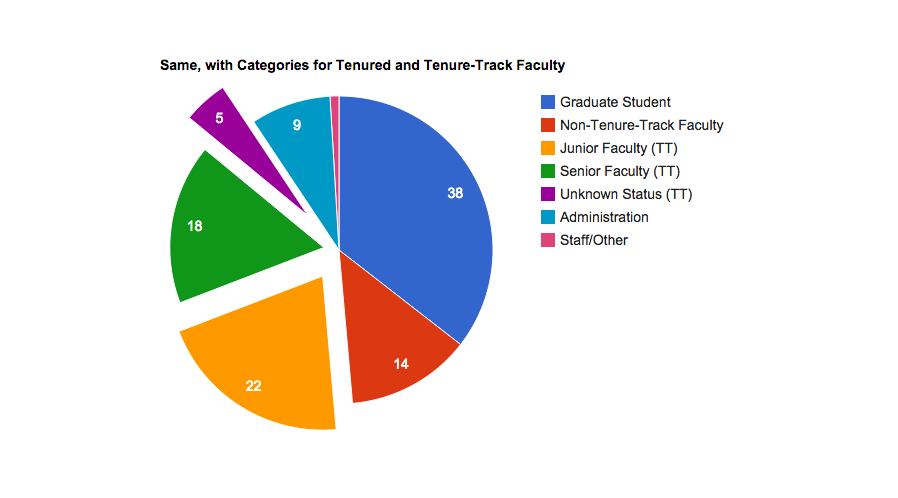
45% of respondents, respectively). For those who reported a seniority or tenure status,
there was an
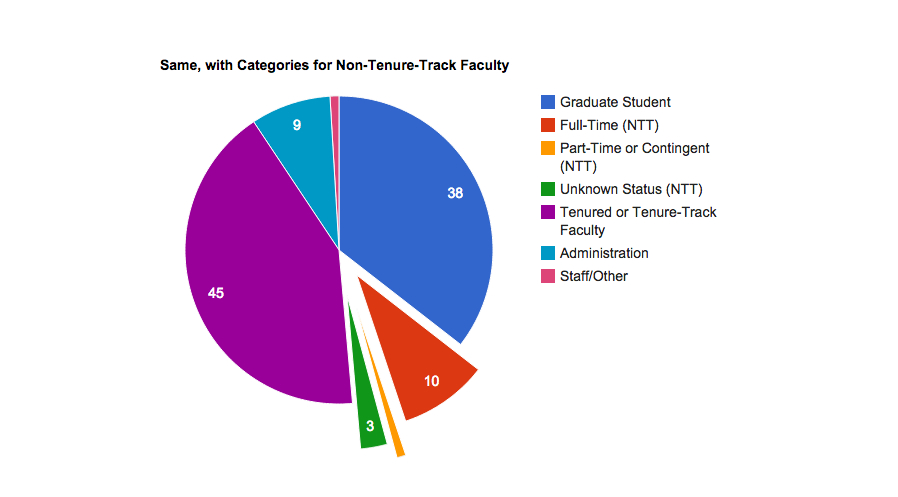
even split between tenure-track or junior faculty and tenured or senior faculty. Non-tenure-track
faculty account for only 14% of survey responses and
administrative positions account for only 9%.