analysis ii
1— ‡ —2— ‡ —3— ‡ —4— ‡ —5— ‡ —6
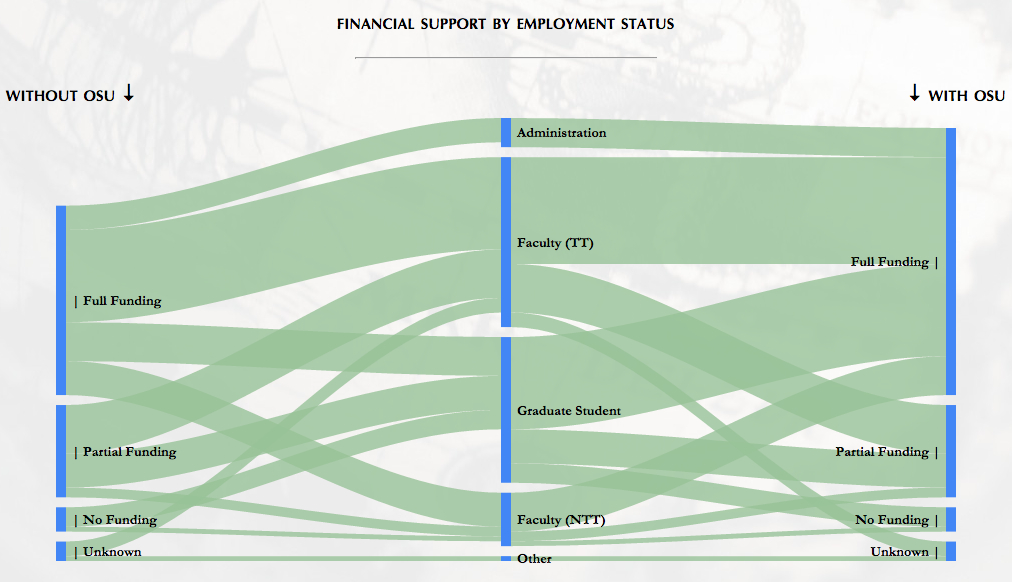
The sankey chart below shows the ratios of DMAC participants' funding. The left column
shows the data without participants from
Ohio State because graduate students can use tuition remission from their program
funding package and faculty/staff can attend in exchange
for some kind of labor (in other words, OSU participants may skew the results towards
full funding). For the chart below,
full funding
designates coverage for all costs associated with DMAC attendance (the Institute fee,
travel, accommodations, etc) and can come from any and as
many sources as needed. Anything else counts as
partial funding,
and
no funding
indicates that the participant paid all expenses out-of-pocket. The length of the
vertical blue
bars indicates the relative frequency of responses in the corresponding categories,
and the green bars indicate the relative frequency of correspondence
between responses in that category and another category (for example: the ratio of
graduate students who received full
funding to attend DMAC to the total number of participants who received full funding).
Most significantly, the chart reveals a higher frequency of
partial funding than one may expect (roughly 50% of the number of faculty who received
full funding, and almost equal to the number of graduate
students who received full funding). Pragmatically, the costs associated with DMAC
attendance (the institute fee, travel, accommodations, and per diem for almost
two weeks) may very well prohibit full funding from most departments and/or institutions,
but the unexpectedly high prevalence of partial funding
may also indicate a need to refine how we make a case in our local contexts for institutional
support of digital media and composition studies.
financial support by employment status
without osu ↓↓ with osu
Click here to download a static image of this chart