maps
1— ‡ —2— ‡ —3— ‡ —4— ‡ —5
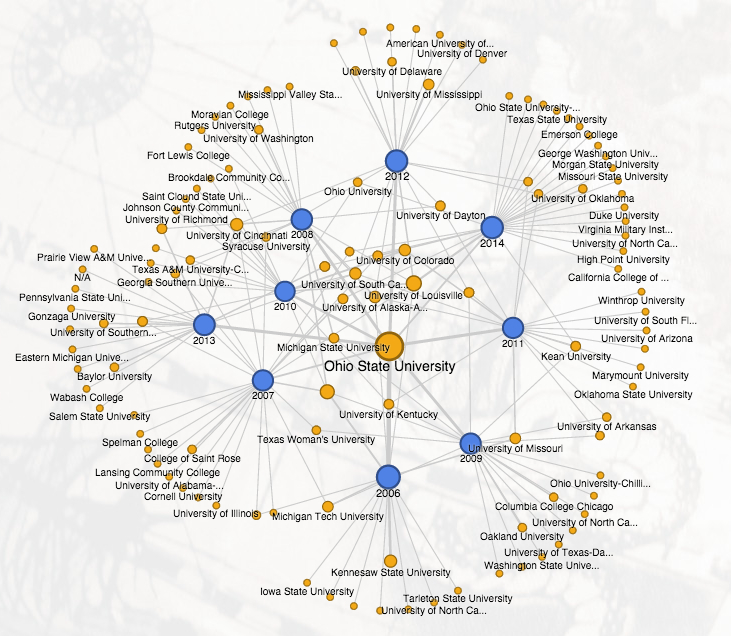
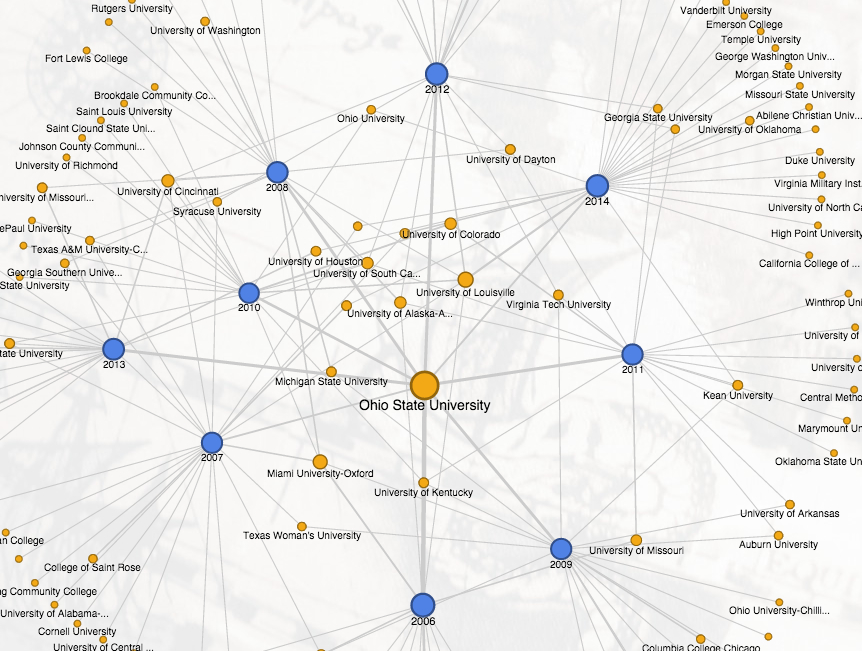
The network map below shows DMAC participants' home institutions arranged by years
of attendance (the size of each circle is proportional to the number of
years that the institution has sent participants to DMAC). The small number of multi-year
institutions at the map's center and the large number of single-year institutions
lining the periphery indicate that DMAC relies on a core group of familiar institutions
and a dynamic roster of one-time participants, both of which the next page maps
geographically.
Click here to download a static image of this map
Click here to download a center detail from the static image of this map