maps
1— ‡ —2— ‡ —3— ‡ —4— ‡ —5
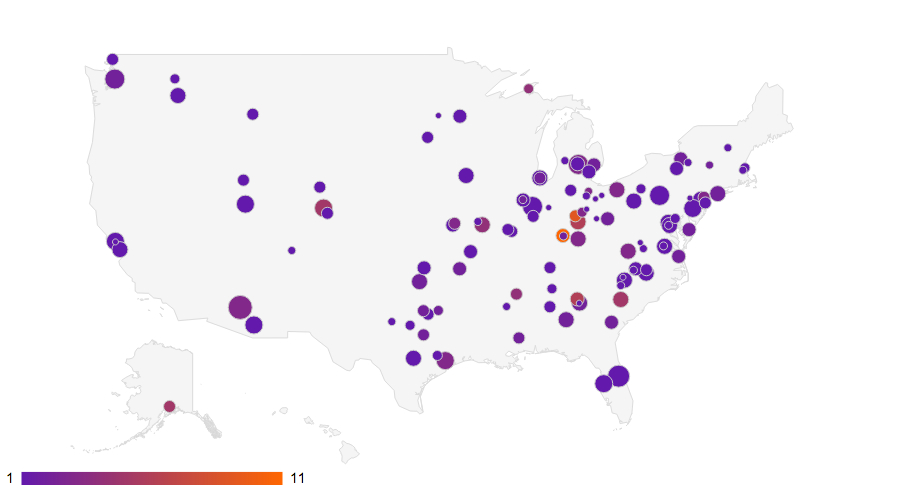
participating institutions by student population and number of pariticpants
The following map plots data points for 117 home institutions and may take a minute
to load. The circle size corresponds to a home institution's student
population, and the circle color corresponds to the number of participants that a
home institution has sent to DMAC (see the color
key). Hover over data points for more information (dense clusters reveal a magnified
view). No relationship between the size of institution and the number of
participants sent to DMAC reveals itself; DMAC, then, must account for the
broadest range of institutional contexts with respect to the implementation of pedagogical
and scholarly paradigms developed in the specific context of two
institutions: The Ohio State University and Michigan Tech University (where DMAC's
predecessor Institute, CIWIC, was held). Indeed, the
taking DMAC home
discussion, typically held during one of the final days of the Institute, remains
the most in-development aspect of its curriculum.
circle size: student population | circle color: number of participants
Click here to download a static image of this mapThe Ohio State University (67 participants, 55014 population) has been excluded from
this data set to avoid
an unbalanced scale. The American University of Cairo (1 participant, 6824 population)
has also been excluded because
the map features only one region: in this case, the United States. One participant
is not included
due to a lack of institutional affiliation at the time of DMAC attendance.