analysis i
1— ‡ —2— ‡ —3— ‡ —4— ‡ —5
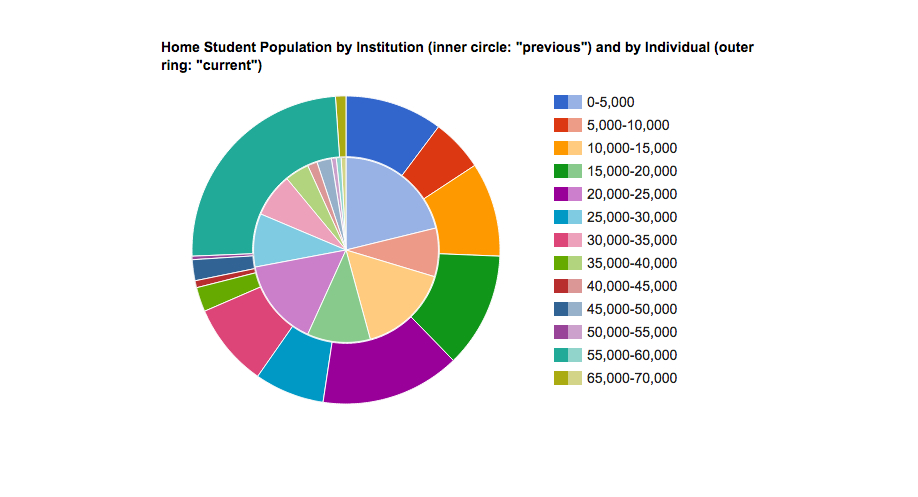
The majority of institutions sending participants to DMAC have a student population
of 20,000 or fewer, but the majority of DMAC participants
come from institutions with a student population of 25,000 or fewer. Smaller institutions
have smaller departments and fewer faculty to send to
DMAC. For example, institutions with a population of 0 to 5,000 account for over 20%
of institutional participation but only about 10% of individual participation.
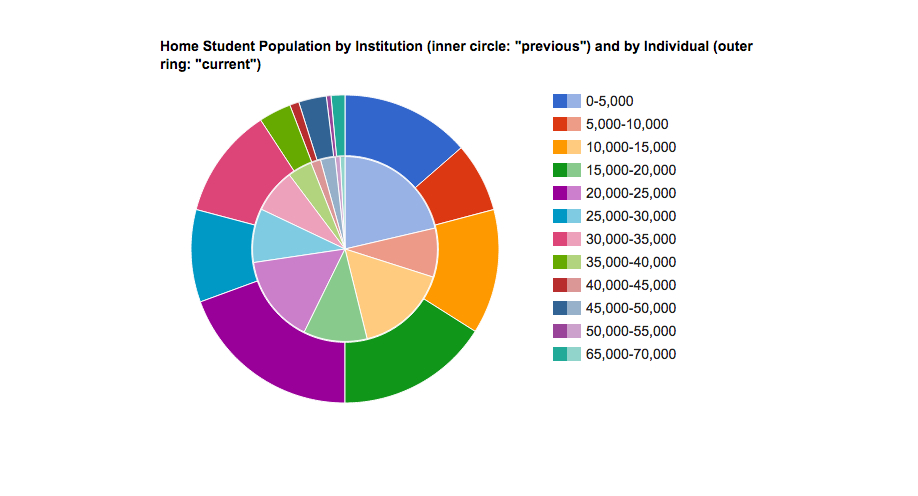
Because the 67 participants from Ohio State dramatically skew the percentages, charts
excluding Ohio State more accurately represent
DMAC's influence beyond its host institution. For both sets, the before
chart is weighed by institution (thus, an institution that has sent one
participant weighs equally with an institution that has sent more than one participant),
and the after
chart is weighed by individual (thus, three
participants from the same institution count three times as much as one participant
from a different institution). The next page considers DMAC participation based on
institutional control (public, private not-for-profit)
and classification (2-year, 4-year, 4-year plus graduate).
Click here to download a static image of this chart
same, without the ohio state university:
Click here to download a static image of this chart